
Page 118 - Condition Monitor User Manual
P. 118
Viewing Measurement Data
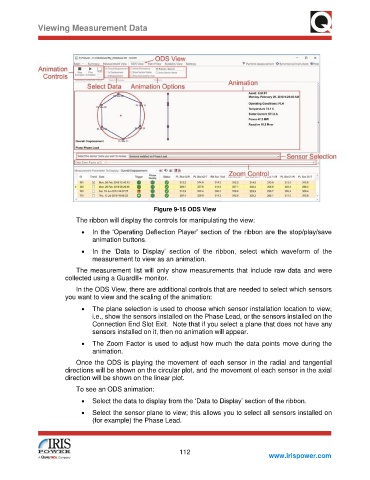
Figure 9-15 ODS View
The ribbon will display the controls for manipulating the view:
• In the ‘Operating Deflection Player’ section of the ribbon are the stop/play/save
animation buttons.
• In the ‘Data to Display’ section of the ribbon, select which waveform of the
measurement to view as an animation.
The measurement list will only show measurements that include raw data and were
collected using a GuardII+ monitor.
In the ODS View, there are additional controls that are needed to select which sensors
you want to view and the scaling of the animation:
• The plane selection is used to choose which sensor installation location to view;
i.e., show the sensors installed on the Phase Lead, or the sensors installed on the
Connection End Slot Exit. Note that if you select a plane that does not have any
sensors installed on it, then no animation will appear.
• The Zoom Factor is used to adjust how much the data points move during the
animation.
Once the ODS is playing the movement of each sensor in the radial and tangential
directions will be shown on the circular plot, and the movement of each sensor in the axial
direction will be shown on the linear plot.
To see an ODS animation:
• Select the data to display from the ‘Data to Display’ section of the ribbon.
• Select the sensor plane to view; this allows you to select all sensors installed on
(for example) the Phase Lead.
112
www.irispower.com