
Page 40 - Next Generation 2015 - Digtial Issue
P. 40
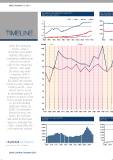
Next Generation Timeline

                                              BOOMING RAW MATERIALS IMPORTS                                                  OECD & NON-OE
                                                                                                                             PERCENTAGE O
                                              Billion tons cargo, 1965-2015

TIMELINE                                                                                            Oil Coal Iron ore Grain  80%      1960
                                                3                                                                            60%
   From the swinging                          2.5                                                                            40%
      sixties, shaky                            2                                                                            20%
                                              1.5
  seventies and awful                           1                                                                                0
   eighties through a                         0.5                                                                               1950
marvellous millennium                           0
   and out the other                            1965 1970 1975 1980 1985 1990 1995 2000 2005 2010 2015
 side to the traumatic
    2010s – the past                          Growth  1950s                  1960s
   50 years has seen                          13%
    a seismic shift in
   shipping fortunes.                         11%
  By 2065 we should
expect a very different                       9%
  trading world – one
   driven by the need                         7%
 to potentially carry 4
tonnes for each of the                        5%
 9.bn people forecast
   to be demanding                             3%
   seaborne trade by
   2050. Somewhere                             1%
   along the way, we
   hope, the industry                         -1%
 will need to find new
 ways to manage the                           -3%
 chaos, especially the
 self-imposed variety.                        -5%
                                                                                                                                                                                            1s
 Sources: Marecon, Lloyd’s List Intelligence
                                              -7%
                                                  1957 1958 1959 1960 1961 1962 1963 1964 1965 1966 1967 1968 1969 1970 1971 1972

                                              NUMBER OF SHIPS BUILT                                                          NUMBER OF BE

                                              1965-2014                                                                      1965-2014

                                              6,000                                                                          3,500
                                              5,000                                                                          3,000
                                              4,000                                                                          2,500
                                              3,000                                                                          2,000
                                              2,000                                                                          1,500
                                              1,000                                                                          1,000

                                                   0                                                                           500
                                                    1965 1970 1975 1980 1985 1990 1995 2000 2005 2010                             0
                                                                                                                                   1965 1970 1

Lloyd’s List Next Generation 2015