
Page 44 - Next Generation 2015 - Digtial Issue
P. 44
Next Generation Past, present and future
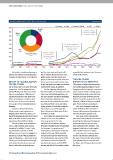
WORLD MERCHANT FLEET BY FLAG 1902- 2015 Source: Marecon
450 Europe Asia Panama & Liberia USA Others
400 Europe The eet of other
Others 12% countries continues
to expand rapidly
350 36%
300
250 W. Europe dominated
shipping until 1978 when
200
USA European owners
“ agged out”
150 1%
Panama & Liberia Panama & Liberia:
100 30% open registry
ags grew rapidly
after 1945
50
0 1912 1922 1932 1942 1952 1962 1972 1982 1992 2002 2012
1902
So in 1965 a transformation was in and the 2007-2008 credit crisis. All seems likely to continue, sets the scene
process and over the next 50 years the six occurred in the period since 1973, for the next 50 years.
industry changed out of all recognition. which works out at five crises in 30
years, or one every six years. This year THE SEA TRADE
IMPACT OF GLOBALISATION comes seven years since the last crisis, SUPER-CYCLE 1965-2015
ON SEA TRADE so you can make your own conclusions
on what that means, if anything. This pattern of regional development
The 50 years since 1965 were generally had another important impact on the
prosperous. But this prosperity was For the shipping industry each shipping market. Bringing a succession
patchy. World gross domestic product decade brought new developments. The of new regions into the trading system
grew at an average of 3.8% per year 1950s saw colonial independence; in introduced long-term cycles into ship
and world seaborne trade grew even the 1960s Europe and Japan rebuilding demand. Sea trade grew much faster
faster, increasing to 13 times its 1950 their economies, importing vast than GDP over the 50 years, but it also
level by 2005. In the process almost amounts of raw materials by sea; This followed a different long-term cyclical
every aspect of the shipping business was followed in the 1970s and 1980s path. There are three clear phases:
changed. by the growth of South Korea and the
Asian Tigers; and in the 1990s the 1960-1980: Seaborne trade was
However, this growth did not Soviet Union and China opened their driven well above the GDP trend as
follow a neat exponential pattern. economies to trade. Europe and Japan went through a raw
Digging a little below the surface, we materials intensive growth cycle.
find that shipping investors had to deal As a result, the regional structure
with cycles which seem to have been of trade in 2015 was very different 1980-1999: Trade fell below the
operating at three different levels. from 50 years earlier. In 1965, GDP trend as the pressure on resources
two-thirds of all seaborne imports caused by the 1960s growth triggered
First of all there were 11 business went into countries in the Organisation the two oil crises of 1973 and 1979,
cycles, some of which were serious for Economic Co-operation and plus commodity price inflation. This
enough to be labelled “crises”. Only Development, the home of traditional triggered a decline in trade coupled
one resulted in a decline in world seafarers. The non-OECD countries with a world economic recession.
GDP, but the six “crises” all triggered a accounted for only one third of trade.
decline in sea trade which rattled the By 2015 the pattern was reversed. The 2000-2015: Sea trade was above
cage of shipowners — the two oil crises non-OECD countries accounted for trend as the world recovered from
in the 1970s; the financial crisis of the two-thirds of imports and the OECD the 1970s crisis and the Asian growth
early 1990s; the 1997 Asia crisis; and for only one-third. This pattern, which cycle gathered force. It started with
the so-called dot.com crisis in 2001; the Tigers, then China picked up in the
late 1990s.
42 | Lloyd’s List Next Generation 2015 | www.lloydslist.com