
Page 46 - Next Generation 2015 - Digtial Issue
P. 46
Next Generation Past, present and future
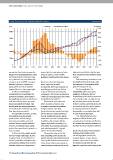
LONG CYCLES IN THE TANKER MARKET 1963-2015 Source: Marecon
dwt Demand Available tanker eet % surplus
500m 55%
45%
400m 35%
300m 25%
15%
200m 5%
100m -5%
-15%
0 1967 1971 1975 1979 1983 1987 1991 1995 1999 2003 2007 2011 -25%
1963 2015
perspective. Over the last 50 years the view is that the trade volume of 20bn high prices; and the fact that the next
tonnage of cargo transported per capita tonnes in 2065 is a more sensible wave of regional super-growth is not in
has increased from 0.5 tonnes in 1965 working assumption than 30bn tonnes. sight yet.
to 1.43 tonnes in 2015. But within that
average, in 2015 the OECD economies Question 3: Another shipping This downswing could take us into
imported 4 tonnes to 6 tonnes per super-cycle 2015 to 2065? the middle of the next decade, when
capita, while non-OECD countries As suggested, there was a long (20-30 the next wave of development of the
imported about 0.4 tonnes per capita. year) shipping cycle during the last global economy picks up.
50 years, with demand and supply
In today’s world of global components. This invites the questions On the supply side, the
communications, the aspirations for “where are we in that super-cycle today shipbuilding super-cycle seems
growth are enormous, and Scenario 1 and will there be another?” unlikely to help much. The last
(see graph page 45) assumes that by 2065 shipbuilding cycle lasted 36 years from
trade has reached 4 tonnes per capita The demand super-cycle was the 1976 peak to the 2011 peak and we
(based on population of 9.5bn). That driven by surges of trade as new are only four years past the last peak.
would require the shipping industry to economies came into the maritime So there could be a long way to go. But
move almost 30bn tonnes of cargo a year, transport system, and sharp on a positive note this cyclical pattern
three times the present level. deceleration as they reached maturity is now programmed into the fleet
and the imports stopped growing so demographic so eventually there will
An alternative Scenario 2 assumes fast. We saw this for Europe; Japan; be a lot of fleet replacement.
that sluggish economic growth, South Korea; and most recently China.
protectionism, climate change, In addition, the oil trade, still the The shipbuilding Scenario 1
increasing commodity prices and biggest single bulk commodity, has suggests a difficult decade, with
technical advances which diminish been driven by a very long-term price capacity above trend demand. But this
resource use would keep per capita cycle which generated a “stop-go” is a variable the industry controls so in
trade at the current level of around 1.4 pattern that caused volatility. principle this time it could be different.
tons per capita.
The position today is that the Question 4: Another new transport
In that case trade volume would cyclical upswing of the last decade system needed before 2065?
increase to only 14bn tonnes in 2065. peaked out and trade could be moving The final question concerns the
A 40% increase. It is not difficult to into a period of below trend growth as transport system. In 1965, the sea
think of a plausible explanation why China slows; oil demand responds to transport system was in the middle
something resembling either of these new technology encouraged by recent of a radical change from the old
scenarios might occur. My personal imperial cargo liners and tramp system
44 | Lloyd’s List Next Generation 2015 | www.lloydslist.com