
Page 59 - DP Vol 20 No 5_Neat
P. 59
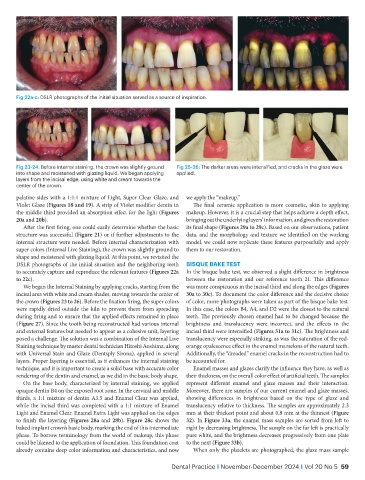
Fig 22a-c: DSLR photographs of the initial situation served as a source of inspiration.


           Fig 23-24: Before internal staining, the crown was slightly ground   Fig 25-26: The darker areas were intensified, and cracks in the glaze were
           into shape and moistened with glazing liquid. We began applying   applied.
           layers from the incisal edge, using white and cream towards the
           center of the crown.
           palatine sides with a 1:1:1 mixture of Light, Super Clear Glaze, and   we apply the “makeup.”
           Violet Glaze (Figures 18 and 19). A strip of Violet modifier dentin in   The final ceramic application is more cosmetic, akin to applying
           the middle third provided an absorption effect for the light (Figures   makeup. However, it is a crucial step that helps achieve a depth effect,
           20a and 20b).                                          bringing out the underlying layers’ information, and gives the restoration
              After the first firing, one could easily determine whether the basic   its final shape (Figures 29a to 29c). Based on our observations, patient
           structure was successful (Figure 21) or if further adjustments to the   data, and the morphology and texture we identified on the working
           internal structure were needed. Before internal characterization with   model, we could now replicate these features purposefully and apply
           super colors (Internal Live Staining), the crown was slightly ground to   them to our restoration.
           shape and moistened with glazing liquid. At this point, we revisited the
           DSLR photographs of the initial situation and the neighboring teeth   BISQUE BAKE TEST
           to accurately capture and reproduce the relevant features (Figures 22a     In the bisque bake test, we observed a slight difference in brightness
           to 22c).                                               between the restoration and our reference tooth 21. This difference
              We began the Internal Staining by applying cracks, starting from the   was more conspicuous in the incisal third and along the edges (Figures
           incisal area with white and cream shades, moving towards the center of   30a to 30c). To document the color difference and the decisive choice
           the crown (Figures 23 to 26). Before the fixation firing, the super colors   of color, more photographs were taken as part of the bisque bake test.
           were rapidly dried outside the kiln to prevent them from spreading   In this case, the colors B4, A4, and D2 were the closest to the natural
           during firing and to ensure that the applied effects remained in place   teeth. The previously chosen enamel had to be changed because the
           (Figure 27). Since the tooth being reconstructed had various internal   brightness and translucency were incorrect, and the effects in the
           and external features but needed to appear as a cohesive unit, layering   incisal third were intensified (Figures 31a to 31c). The brightness and
           posed a challenge. The solution was a combination of the Internal Live   translucency were especially striking, as was the saturation of the red-
           Staining technique by master dental technician Hitoshi Aoshima, along   orange opalescence effect in the enamel mamelons of the natural teeth.
           with Universal Stain and Glaze (Dentsply Sirona), applied in several   Additionally, the “dreaded” enamel cracks in the reconstruction had to
           layers. Proper layering is essential, as it enhances the internal staining   be accounted for.
           technique, and it is important to create a solid base with accurate color   Enamel masses and glazes clarify the influence they have, as well as
           rendering of the dentin and enamel, as we did in the basic body shape.  their thickness, on the overall color effect of artificial teeth. The samples
              On the base body, characterized by internal staining, we applied   represent different enamel and glaze masses and their interaction.
           opaque dentin B4 on the exposed root zone. In the cervical and middle   Moreover, there are samples of our current enamel and glaze masses,
           thirds, a 1:1 mixture of dentin A3.5 and Enamel Clear was applied,   showing differences in brightness based on the type of glaze and
           while the incisal third was completed with a 1:1 mixture of Enamel   translucency relative to thickness. The samples are approximately 2.3
           Light and Enamel Clear. Enamel Extra Light was applied on the edges   mm at their thickest point and about 0.8 mm at the thinnest (Figure
           to finish the layering (Figures 28a  and  28b).  Figure 28c shows the   32). In Figure 33a, the enamel mass samples are sorted from left to
           baked implant crown’s basic body, marking the end of this intermediate   right by decreasing brightness. The sample on the far left is practically
           phase. To borrow terminology from the world of makeup, this phase   pure white, and the brightness decreases progressively from one plate
           could be likened to the application of foundation. This foundation coat   to the next (Figure 33b).
           already contains deep color information and characteristics, and now   When only the platelets are photographed, the glaze mass sample

                                                              Dental Practice I November-December 2024 I Vol 20 No 5  59