
Page 29 - Professorial Lecture - Prof Oyedele
P. 29
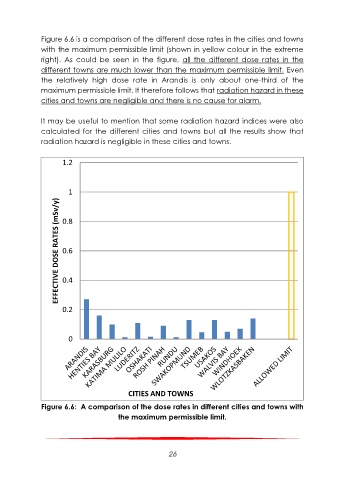
Figure 6.6 is a comparison of the different dose rates in the cities and towns
           with the maximum permissible limit (shown in yellow colour in the extreme
           right).  As  could  be  seen  in  the  figure,  all  the  different  dose  rates  in  the
           different towns are much lower than the maximum permissible limit. Even
           the  relatively  high  dose  rate  in  Arandis  is  only  about  one-third  of  the
           maximum permissible limit. It therefore follows that radiation hazard in these
           cities and towns are negligible and there is no cause for alarm.

           It may be useful to mention that some radiation hazard indices were also
           calculated for the different cities and  towns but all the results show  that
           radiation hazard is negligible in these cities and towns.

                 1.2


                  1
               EFFECTIVE DOSE RATES (mSv/y)  0.6

                 0.8


                 0.4


                 0.2


                  0


                                 CITIES AND TOWNS

           Figure 6.6:  A comparison of the dose rates in different cities and towns with
                              the maximum permissible limit.