
Page 27 - Professorial Lecture - Prof Oyedele
P. 27
Uranium Thorium Potassium
Average radioactivity concentrations
600
500
400
(Bq/kg) 300
200
100
0
1 2 3 4 5 6 7 8 9 10
Geographical areas
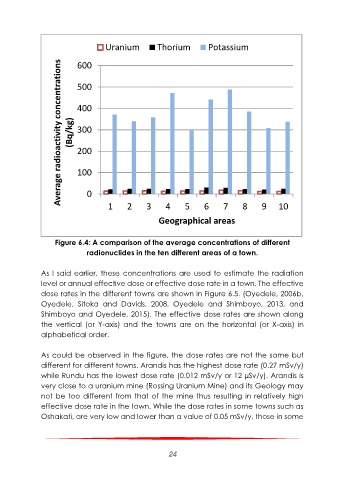
Figure 6.4: A comparison of the average concentrations of different
radionuclides in the ten different areas of a town.
As I said earlier, these concentrations are used to estimate the radiation
level or annual effective dose or effective dose rate in a town. The effective
dose rates in the different towns are shown in Figure 6.5. (Oyedele, 2006b,
Oyedele, Sitoka and Davids, 2008, Oyedele and Shimboyo, 2013, and
Shimboyo and Oyedele, 2015). The effective dose rates are shown along
the vertical (or Y-axis) and the towns are on the horizontal (or X-axis) in
alphabetical order.
As could be observed in the figure, the dose rates are not the same but
different for different towns. Arandis has the highest dose rate (0.27 mSv/y)
while Rundu has the lowest dose rate (0.012 mSv/y or 12 µSv/y). Arandis is
very close to a uranium mine (Rossing Uranium Mine) and its Geology may
not be too different from that of the mine thus resulting in relatively high
effective dose rate in the town. While the dose rates in some towns such as
Oshakati, are very low and lower than a value of 0.05 mSv/y, those in some