Page 26 - Live-cellanalysis handbook
P. 26

Live-Cell Analysis Handbook — Third Edition


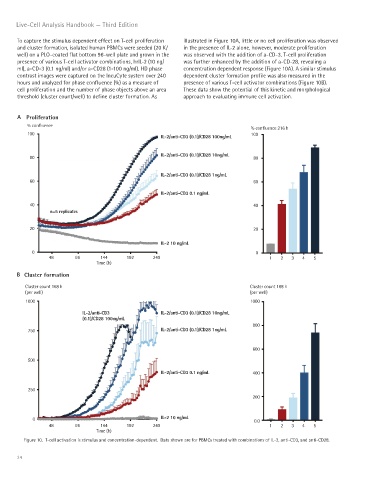
       To capture the stimulus dependent effect on T-cell proliferation   illustrated in Figure 10A, little or no cell proliferation was observed
       and cluster formation, isolated human PBMCs were seeded (20 K/  in the presence of IL-2 alone, however, moderate proliferation
       well) on a PLO-coated flat bottom 96-well plate and grown in the   was observed with the addition of a-CD-3. T-cell proliferation
       presence of various T-cell activator combinations, hrIL-2 (10 ng/  was further enhanced by the addition of a-CD-28, revealing a
       ml), a-CD-3 (0.1 ng/ml) and/or a-CD28 (1-100 ng/ml). HD phase   concentration dependent response (Figure 10A). A similar stimulus
       contrast images were captured on the IncuCyte system over 240   dependent cluster formation profile was also measured in the
       hours and analyzed for phase confluence (%) as a measure of   presence of various T-cell activator combinations (Figure 10B).
       cell proliferation and the number of phase objects above an area   These data show the potential of this kinetic and morphological
       threshold (cluster count/well) to define cluster formation. As   approach to evaluating immune cell activation.


       A  Proliferation
          % confluence
                                                                                    % confluence 216 h
          100                                                                       100
                                                      IL-2/anti-CD3 (0.1)/CD28 100ng/mL

                                                      IL-2/anti-CD3 (0.1)/CD28 10ng/mL
           80                                                                        80

                                                      IL-2/anti-CD3 (0.1)/CD28 1ng/mL
           60                                                                        60
                                                      IL-2/anti-CD3 0.1 ng/mL

           40                                                                        40
                  n=5 replicates

           20                                                                        20


                                                      IL-2 10 ng/mL
            0                                                                         0
                 48       96      144      192      240                                   1   2  3   4   5
                                 Time (h)
       B  Cluster formation
         Cluster count 168 h                                                        Cluster count 168 h
         (per well)                                                                 (per well)
         1000                                                                       1000
                            IL-2/anti-CD3             IL-2/anti-CD3 (0.1)/CD28 10ng/mL
                            (0.1)/CD28 100ng/mL
                                                                                     800
          750                                         IL-2/anti-CD3 (0.1)/CD28 1ng/mL

                                                                                     600

          500
                                                      IL-2/anti-CD3 0.1 ng/mL        400


          250
                                                                                     200


            0                                         IL-2 10 ng/mL                  0.0
                 48       96      144      192      240                                   1   2  3   4   5
                                 Time (h)
         Figure 10.  T-cell activation is stimulus and concentration-dependent.  Data shown are for PBMCs treated with combinations of IL-2, anti-CD3, and anti-CD28.


       24
   21   22   23   24   25   26   27   28   29   30   31