
Page 25 - Live-cellanalysis handbook
P. 25
Kinetic Proliferation Assays
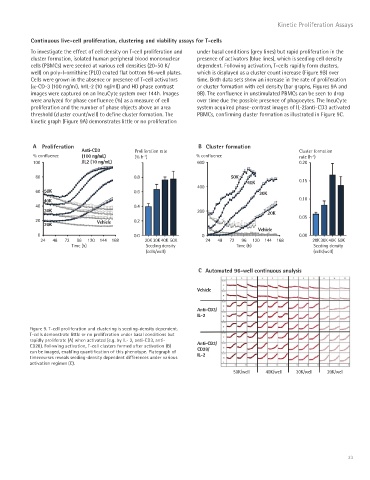
Continuous live-cell proliferation, clustering and viability assays for T-cells
To investigate the effect of cell density on T-cell proliferation and under basal conditions (grey lines) but rapid proliferation in the
cluster formation, isolated human peripheral blood mononuclear presence of activators (blue lines), which is seeding cell density
cells (PBMCs) were seeded at various cell densities (20-50 K/ dependent. Following activation, T-cells rapidly form clusters,
well) on poly-l-ornithine (PLO) coated flat bottom 96-well plates. which is displayed as a cluster count increase (Figure 9B) over
Cells were grown in the absence or presence of T-cell activators time. Both data sets show an increase in the rate of proliferation
(a-CD-3 (100 ng/ml), hrIL-2 (10 ng/ml)) and HD phase contrast or cluster formation with cell density (bar graphs, Figures 9A and
images were captured on an IncuCyte system over 144h. Images 9B). The confluence in unstimulated PBMCs can be seen to drop
were analyzed for phase confluence (%) as a measure of cell over time due the possible presence of phagocytes. The IncuCyte
proliferation and the number of phase objects above an area system acquired phase-contrast images of IL-2/anti-CD3 activated
threshold (cluster count/well) to define cluster formation. The PBMCs, confirming cluster formation as illustrated in Figure 9C.
kinetic graph (Figure 9A) demonstrates little or no proliferation
A Proliferation B Cluster formation
Anti-CD3 Proliferation rate Cluster formation
% confluence (100 ng/mL) (% h ) % confluence rate (h )
-1
-1
100 /IL2 (10 ng/mL) 1.0 600 0.20
80 0.8 50K
40K 0.15
400
60 50K 0.6 30K
40K 0.10
40 0.4
30K 200 20K
20 Vehicle 0.2 0.05
20K
Vehicle
0 0.0 0 0.00
24 48 72 96 120 144 168 20K30K40K 50K 24 48 72 96 120 144 168 20K30K40K 50K
Time (h) Seeding density Time (h) Seeding density
(cells/well) (cells/well)
C Automated 96-well continuous analysis
Vehicle
Anti-CD3/
IL-2
Figure 9. T-cell proliferation and clustering is seeding-density dependent.
T-cells demonstrate little or no proliferation under basal conditions but
rapidly proliferate (A) when activated (e.g. by IL- 2, anti-CD3, anti- Anti-CD3/
CD28). Following activation, T-cell clusters formed after activation (B) CD28/
can be imaged, enabling quantification of this phenotype. Plategraph of IL-2
timecourses reveals seeding-density dependent differences under various
activation regimes (C).
50K/well 40K/well 30K/well 20K/well
23