
Page 20 - Live-cellanalysis handbook
P. 20
Live-Cell Analysis Handbook — Third Edition
Sample Results
Validation data for label-free and fluorescent approaches
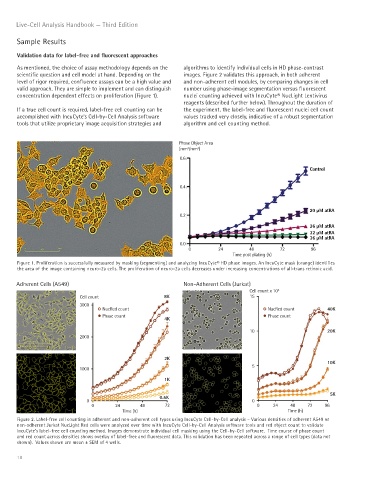
As mentioned, the choice of assay methodology depends on the algorithms to identify individual cells in HD phase-contrast
scientific question and cell model at hand. Depending on the images. Figure 2 validates this approach, in both adherent
level of rigor required, confluence assays can be a high value and and non-adherent cell modules, by comparing changes in cell
valid approach. They are simple to implement and can distinguish number using phase-image segmentation versus fluorescent
concentration dependent effects on proliferation (Figure 1). nuclei counting achieved with IncuCyte® NucLight Lentivirus
reagents (described further below). Throughout the duration of
If a true cell count is required, label-free cell counting can be the experiment, the label-free and fluorescent nuclei cell count
accomplished with IncuCyte’s Cell-by-Cell Analysis software values tracked very closely, indicative of a robust segmentation
tools that utilize proprietary image acquisition strategies and algorithm and cell counting method.
Phase Object Area
2
2
(mm /mm )
0.6
Control
0.4
20 µM atRA
0.2
26 µM atRA
32 µM atRA
36 µM atRA
0.0
0 24 48 72 96
Time post plating (h)
Figure 1. Proliferation is successfully measured by masking (segmenting) and analyzing IncuCyte® HD phase images. An IncuCyte mask (orange) identifies
the area of the image containing neuro-2a cells. The proliferation of neuro-2a cells decreases under increasing concentrations of all-trans retinoic acid.
Adherent Cells (A549) Non-Adherent Cells (Jurkat)
Cell count x 10 4
Cell count 8K 15
3000
NucRed count NucRed count 40K
Phase count Phase count
4K
10 20K
2000
2K
5 10K
1000
1K
5K
0.5K
0 0
0 24 48 72 0 24 48 72 96
Time (h) Time (h)
Figure 2. Label-free cell counting in adherent and non-adherent cell types using IncuCyte Cell-by-Cell analysis – Various densities of adherent A549 or
non-adherent Jurkat NucLight Red cells were analyzed over time with IncuCyte Cell-by-Cell Analysis software tools and red object count to validate
IncuCyte’s label-free cell counting method. Images demonstrate individual cell masking using the Cell-by-Cell software. Time course of phase count
and red count across densities shows overlay of label-free and fluorescent data. This validation has been repeated across a range of cell types (data not
shown). Values shown are mean ± SEM of 4 wells.
18