
Page 24 - Live-cellanalysis handbook
P. 24
Live-Cell Analysis Handbook — Third Edition
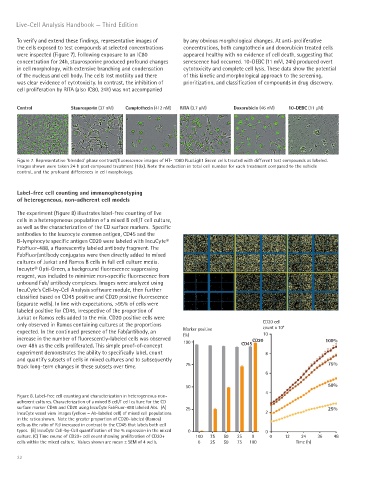
To verify and extend these findings, representative images of by any obvious morphological changes. At anti-proliferative
the cells exposed to test compounds at selected concentrations concentrations, both camptothecin and doxorubicin treated cells
were inspected (Figure 7). Following exposure to an IC80 appeared healthy with no evidence of cell death, suggesting that
concentration for 24h, staurosporine produced profound changes senescence had occurred. 10-DEBC (11 mM, 24h) produced overt
in cell morphology, with extensive branching and condensation cytotoxicity and complete cell lysis. These data show the potential
of the nucleus and cell body. The cells lost motility and there of this kinetic and morphological approach to the screening,
was clear evidence of cytotoxicity. In contrast, the inhibition of prioritization, and classification of compounds in drug discovery.
cell proliferation by RITA (also IC80, 24h) was not accompanied
Control Staurosporin (37 nM) Camptothecin (412 nM) RITA (3.7 μM) Doxorubicin (46 nM) 10-DEBC (11 μM)
Figure 7. Representative ‘blended’ phase contrast/fluorescence images of HT- 1080 NucLight Green cells treated with different test compounds as labeled.
Images shown were taken 24 h post compound treatment (10x). Note the reduction in total cell number for each treatment compared to the vehicle
control, and the profound differences in cell morphology.
Label-free cell counting and immunophenotyping
of heterogeneous, non-adherent cell models
The experiment (Figure 8) illustrates label-free counting of live
cells in a heterogeneous population of a mixed B cell/T cell culture,
as well as the characterization of the CD surface markers. Specific
antibodies to the leucocyte common antigen, CD45 and the
B-lymphocyte specific antigen CD20 were labeled with IncuCyte®
FabFluor-488, a fluorescently labeled antibody fragment. The
FabFluor/antibody conjugates were then directly added to mixed
cultures of Jurkat and Ramos B cells in full cell culture media.
Incuyte® Opti-Green, a background fluorescence suppressing
reagent, was included to minimize non-specific fluorescence from
unbound Fab/ antibody complexes. Images were analyzed using
IncuCyte’s Cell-by-Cell Analysis software module, then further
classified based on CD45 positive and CD20 positive fluorescence
(separate wells). In line with expectations, >95% of cells were
labeled positive for CD45, irrespective of the proportion of
Jurkat or Ramos cells added to the mix. CD20 positive cells were
only observed in Ramos containing cultures at the proportions CD20 cell 4
expected. In the continued presence of the Fab/antibody, an Marker positive count x 10
10
increase in the number of fluorescently-labeled cells was observed (%) CD20 100%
over 48h as the cells proliferated. This simple proof-of-concept 100 CD45
experiment demonstrates the ability to specifically label, count 8
and quantify subsets of cells in mixed cultures and to subsequently
track long-term changes in these subsets over time. 75 75%
6
50 50%
4
Figure 8. Label-free cell counting and characterization in heterogeneous non-
adherent cultures. Characterization of a mixed B cell/T cell culture for the CD
surface marker CD45 and CD20 using IncuCyte FabFluor-488 labeled Abs. (A) 25 25%
IncuCyte vessel view images (yellow = Ab-labeled cell) of mixed cell populations 2
in the ratios shown. Note the greater proportion of CD20-labeled (Ramos)
cells as the ratio of R:J increased in contrast to the CD45 that labels both cell
types. (B) IncuCyte Cell-by-Cell quantification of the % expression in the mixed 0 0
culture. (C) Time course of CD20+ cell count showing proliferation of CD20+ 100 75 50 25 0 0 12 24 36 48
cells within the mixed culture. Values shown are mean ± SEM of 4 wells. 0 25 50 75 100 Time (h)
22