Page 23 - Live-cellanalysis handbook
P. 23

Kinetic Proliferation Assays


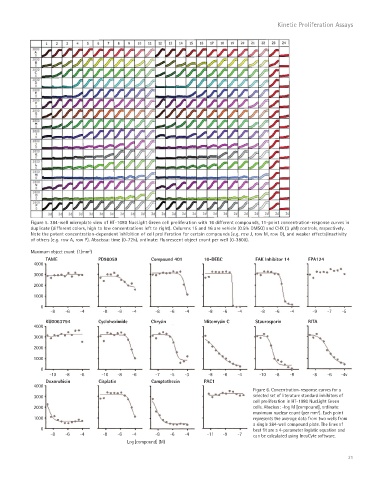
           Figure 5. 384-well microplate view of HT-1080 NucLight Green cell proliferation with 16 different compounds, 11-point concentration-response curves in
           duplicate (different colors, high to low concentrations left to right). Columns 15 and 16 are vehicle (0.5% DMSO) and CHX (3 μM) controls, respectively.
           Note the potent concentration-dependent inhibition of cell proliferation for certain compounds (e.g. row J, row M, row O), and weaker effects/inactivity
           of others (e.g. row A, row P). Abscissa: time (0-72h), ordinate: fluorescent object count per well (0-3800).
           Maximum object count  (1/mm ) 2
                TAME              PD98059          Compound 401     10-DEBC           FAK Inhibitor 14  FPA124
            4000
            3000
            2000
            1000

               0
                  -8   -6  -4      -8   -6   -4     -8   -6   -4      -8   -6   -4     -8   -6   -4     -9   -7   -5
                KU0063794         Cycloheximide    Chrysin          Mitomysin C       Staurosporin     RITA
            4000
            3000
            2000
            1000

               0
                 -10   -8  -6      -10  -8   -6     -7   -5   -3      -8   -6   -4     -10  -8   -8     -8   -6   -4v
                Doxorubicin       Cisplatin        Camptothecin      PAC1
            4000
                                                                                     Figure 6. Concentration-response curves for a
            3000                                                                     selected set of literature standard inhibitors of
                                                                                     cell proliferation in HT-1080 NucLight Green
            2000                                                                     cells. Abscissa: -log M [compound], ordinate:
                                                                                     maximum nuclear count (per mm ). Each point
                                                                                                          2
            1000                                                                     represents the average data from two wells from
                                                                                     a single 384-well compound plate. The lines of
               0                                                                     best fit are a 4-parameter logistic equation and
                  -8   -6  -4      -8   -6   -4     -8   -6   -4      -11  -9   -7   can be calculated using IncuCyte software.
                                           Log[compound] (M)


                                                                                                                    21
   18   19   20   21   22   23   24   25   26   27   28