
Page 172 - Feline diagnostic imaging
P. 172
10.7 Doppler 173
the minimum velocity of the sampling gate on one end flow with stenosis and regurgitant blood flow will be dis-
and the maximum velocity on the other. Once the maxi- played as a disorganized mosaic of colors.
mum sampling velocity is reached, more colors are dis-
played due to the increase in velocity but do not necessarily 10.7.2 Pulsed-Wave Doppler
indicate turbulent flow due to pathology. Physiologic aor-
tic insufficiency is not as common, none being found in a Pulsed‐wave Doppler samples the velocity of blood flow at
group of 104 normal cats [10]. a specific site. However, only a limited range or depth can
The TV can be found by rotating the probe away from the be evaluated with this mode. Pulsed‐wave Doppler works
LVOT and dropping the handle of the probe toward the well for normal velocities which are typically around 1 m/s,
table. Color Doppler imaging of the TV is similar to the MV but once the velocity threshold is exceeded, the waveform
(Figure 10.36). Physiologic tricuspid regurgitation was develops aliasing. Aliasing appears as the waveform wrap-
found most commonly in a study of 104 cats [11]. Turbulent ping around the baseline since the maximum velocity
exceeds the Nyquist limit [11].
10.7.3 Continuous-Wave Doppler
In continuous‐wave Doppler, sound waves are continu-
ously transmitted and received. There is no limitation on
the range or depth for continuous‐wave Doppler so high
velocities can be measured. The disadvantage of continu-
ous‐wave Doppler is that everything along the cursor will
contribute to the image without the ability to define the
exact position of the abnormal flow. The result is that nor-
mal waveforms appear filled in due to the contribution
from these lower velocity echoes [11].
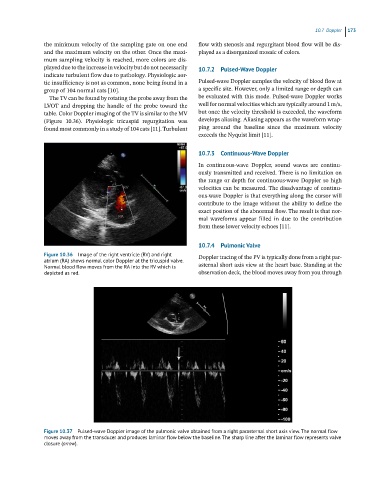
10.7.4 Pulmonic Valve
Figure 10.36 Image of the right ventricle (RV) and right Doppler tracing of the PV is typically done from a right par-
atrium (RA) shows normal color Doppler at the tricuspid valve.
Normal blood flow moves from the RA into the RV which is asternal short axis view at the heart base. Standing at the
depicted as red. observation deck, the blood moves away from you through
Figure 10.37 Pulsed-wave Doppler image of the pulmonic valve obtained from a right parasternal short axis view. The normal flow
moves away from the transducer and produces laminar flow below the baseline. The sharp line after the laminar flow represents valve
closure (arroe).