
Page 171 - Feline diagnostic imaging
P. 171
172 10 Normal Cardiovascular Imaging
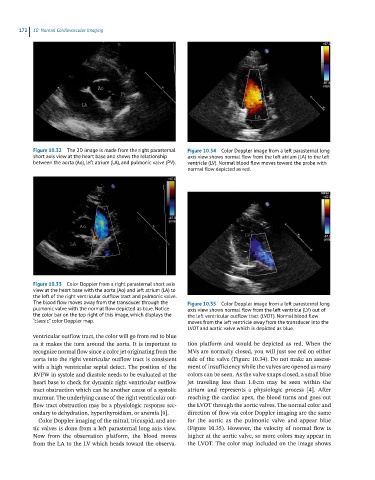
Figure 10.32 The 2D image is made from the right parasternal Figure 10.34 Color Doppler image from a left parasternal long
short axis view at the heart base and shows the relationship axis view shows normal flow from the left atrium (LA) to the left
between the aorta (Ao), left atrium (LA), and pulmonic valve (PV). ventricle (LV). Normal blood flow moves toward the probe with
normal flow depicted as red.
Figure 10.33 Color Doppler from a right parasternal short axis
view at the heart base with the aorta (Ao) and left atrium (LA) to
the left of the right ventricular outflow tract and pulmonic valve.
The blood flow moves away from the transducer through the Figure 10.35 Color Doppler image from a left parasternal long
pulmonic valve with the normal flow depicted as blue. Notice axis view shows normal flow from the left ventricle (LV) out of
the color bar on the top right of this image, which displays the the left ventricular outflow tract (LVOT). Normal blood flow
“classic” color Doppler map. moves from the left ventricle away from the transducer into the
LVOT and aortic valve which is depicted as blue.
ventricular outflow tract, the color will go from red to blue
as it makes the turn around the aorta. It is important to tion platform and would be depicted as red. When the
recognize normal flow since a color jet originating from the MVs are normally closed, you will just see red on either
aorta into the right ventricular outflow tract is consistent side of the valve (Figure 10.34). Do not make an assess-
with a high ventricular septal defect. The position of the ment of insufficiency while the valves are opened as many
RVFW in systole and diastole needs to be evaluated at the colors can be seen. As the valve snaps closed, a small blue
heart base to check for dynamic right ventricular outflow jet traveling less than 1.0 cm may be seen within the
tract obstruction which can be another cause of a systolic atrium and represents a physiologic process [4]. After
murmur. The underlying cause of the right ventricular out- reaching the cardiac apex, the blood turns and goes out
flow tract obstruction may be a physiologic response sec- the LVOT through the aortic valves. The normal color and
ondary to dehydration, hyperthyroidism, or anemia [9]. direction of flow via color Doppler imaging are the same
Color Doppler imaging of the mitral, tricuspid, and aor- for the aortic as the pulmonic valve and appear blue
tic valves is done from a left parasternal long axis view. (Figure 10.35). However, the velocity of normal flow is
Now from the observation platform, the blood moves higher at the aortic valve, so more colors may appear in
from the LA to the LV which heads toward the observa- the LVOT. The color map included on the image shows