
Page 29 - Feline diagnostic imaging
P. 29
22 2 Principles of Computed Tomography and Magnetic Resonance Imaging
that accumulate gadolinium within them “contrast spatial resolution. This is accomplished by adjusting the
enhance” on T1‐weighted sequences [1, 3, 7]. slice thickness, field of view, and matrix size (Figure 2.12).
Magnetic resonance sequences are optimized to achieve Smaller voxel size through decreasing either the field of
adequate spatial resolution and image quality. The desire is view or the slice thickness will achieve this goal but comes
to have the smallest voxel size possible as this yields greater with a cost. This cost is signal. Smaller voxels will have less
signal, leading to a serious degradation in image quality.
Techniques such as signal averaging can be instituted to
Table 2.3 Estimates of various T1 and T2 time for various
biological tissues compensate for this, but will add significant time to the
scan. As a result, there is a balance between adequate sig-
T1 at 1.5 T (ms) T2 (ms) nal, scan time, and spatial resolution that needs to be
achieved [8].
Cerebrospinal fluid 2400 160
Gray matter 900 100 2.4.4 Magnetic Resonance Summary
White matter 780 90
Muscle 870 45 Magnetic resonance is a complex imaging modality.
Liver 500 40 Through the use of electromagnetic properties of primarily
hydrogen protons, images of excellent contrast resolution
Fat 260 80 can be obtained in all three planes (Figure 2.13). Usually a
Source: Reference [1]. combination of sequences is performed in various planes,
(a)
T1
1
0.9
0.8
0.7
0.6
0.5
0.4
0.3
0.2
0.1
0
0 1000 2000 3000 4000 5000
(b)
T2 decay
1
0.9
0.8
0.7
0.6
0.5
0.4
0.3
0.2
0.1
0
0 100 200 300 400 500
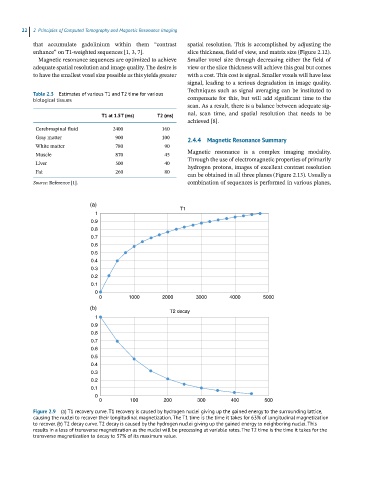
Figure 2.9 (a) T1 recovery curve. T1 recovery is caused by hydrogen nuclei giving up the gained energy to the surrounding lattice,
causing the nuclei to recover their longitudinal magnetization. The T1 time is the time it takes for 63% of longitudinal magnetization
to recover. (b) T2 decay curve. T2 decay is caused by the hydrogen nuclei giving up the gained energy to neighboring nuclei. This
results in a loss of transverse magnetization as the nuclei will be precessing at variable rates. The T2 time is the time it takes for the
transverse magnetization to decay to 37% of its maximum value.