
Page 27 - Feline diagnostic imaging
P. 27
20 2 Principles of Computed Tomography and Magnetic Resonance Imaging
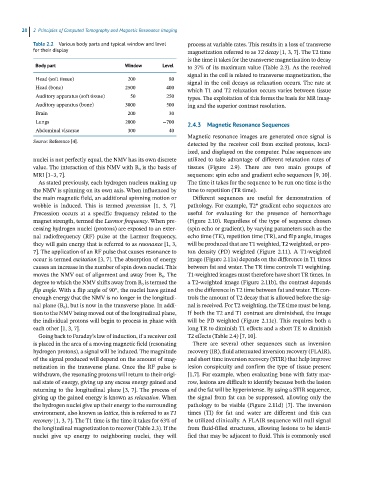
Table 2.2 Various body parts and typical window and level process at variable rates. This results in a loss of transverse
for their display magnetization referred to as T2 decay [1, 3, 7]. The T2 time
is the time it takes for the transverse magnetization to decay
Body part Window Level to 37% of its maximum value (Table 2.3). As the received
signal in the coil is related to transverse magnetization, the
Head (soft tissue) 200 80 signal in the coil decays as relaxation occurs. The rate at
Head (bone) 2500 400 which T1 and T2 relaxation occurs varies between tissue
Auditory apparatus (soft tissue) 50 250 types. The exploitation of this forms the basis for MR imag-
Auditory apparatus (bone) 3000 500 ing and the superior contrast resolution.
Brain 200 30
Lungs 2000 −700 2.4.3 Magnetic Resonance Sequences
Abdominal viscerae 300 40
Magnetic resonance images are generated once signal is
Source: Reference [4]. detected by the receiver coil from excited protons, local-
ized, and displayed on the computer. Pulse sequences are
nuclei is not perfectly equal, the NMV has its own discrete utilized to take advantage of different relaxation rates of
value. The interaction of this NMV with B o is the basis of tissues (Figure 2.9). There are two main groups of
MRI [1–3, 7]. sequences: spin echo and gradient echo sequences [9, 10].
As stated previously, each hydrogen nucleus making up The time it takes for the sequence to be run one time is the
the NMV is spinning on its own axis. When influenced by time to repetition (TR time).
the main magnetic field, an additional spinning motion or Different sequences are useful for demonstration of
wobble is induced. This is termed precession [1, 3, 7]. pathology. For example, T2* gradient echo sequences are
Precession occurs at a specific frequency related to the useful for evaluating for the presence of hemorrhage
magnet strength, termed the Larmor frequency. When pre- (Figure 2.10). Regardless of the type of sequence chosen
cessing hydrogen nuclei (protons) are exposed to an exter- (spin echo or gradient), by varying parameters such as the
nal radiofrequency (RF) pulse at the Larmor frequency, echo time (TE), repetition time (TR), and flip angle, images
they will gain energy that is referred to as resonance [1, 3, will be produced that are T1 weighted, T2 weighted, or pro-
7]. The application of an RF pulse that causes resonance to ton density (PD) weighted (Figure 2.11). A T1‐weighted
occur is termed excitation [3, 7]. The absorption of energy image (Figure 2.11a) depends on the difference in T1 times
causes an increase in the number of spin down nuclei. This between fat and water. The TR time controls T1 weighting.
moves the NMV out of alignment and away from B o . The T1‐weighted images must therefore have short TR times. In
degree to which the NMV shifts away from B o is termed the a T2‐weighted image (Figure 2.11b), the contrast depends
flip angle. With a flip angle of 90°, the nuclei have gained on the difference in T2 time between fat and water. TE con-
enough energy that the NMV is no longer in the longitudi- trols the amount of T2 decay that is allowed before the sig-
nal plane (B o ), but is now in the transverse plane. In addi- nal is received. For T2 weighting, the TE time must be long.
tion to the NMV being moved out of the longitudinal plane, If both the T2 and T1 contrast are diminished, the image
the individual protons will begin to process in phase with will be PD weighted (Figure 2.11c). This requires both a
each other [1, 3, 7]. long TR to diminish T1 effects and a short TE to diminish
Going back to Faraday’s law of induction, if a receiver coil T2 effects (Table 2.4) [7, 10].
is placed in the area of a moving magnetic field (resonating There are several other sequences such as inversion
hydrogen protons), a signal will be induced. The magnitude recovery (IR), fluid attenuated inversion recovery (FLAIR),
of the signal produced will depend on the amount of mag- and short time inversion recovery (STIR) that help improve
netization in the transverse plane. Once the RF pulse is lesion conspicuity and confirm the type of tissue present
withdrawn, the resonating protons will return to their origi- [1,7]. For example, when evaluating bone with fatty mar-
nal state of energy, giving up any excess energy gained and row, lesions are difficult to identify because both the lesion
returning to the longitudinal plane [3, 7]. The process of and the fat will be hyperintense. By using a STIR sequence,
giving up the gained energy is known as relaxation. When the signal from fat can be suppressed, allowing only the
the hydrogen nuclei give up their energy to the surrounding pathology to be visible (Figure 2.11d) [7]. The inversion
environment, also known as lattice, this is referred to as T1 times (TI) for fat and water are different and this can
recovery [1, 3, 7]. The T1 time is the time it takes for 63% of be utilized clinically. A FLAIR sequence will null signal
the longitudinal magnetization to recover (Table 2.3). If the from fluid‐filled structures, allowing lesions to be identi-
nuclei give up energy to neighboring nuclei, they will fied that may be adjacent to fluid. This is commonly used