


Page 69 - MAT KS3 Y8 Cambridge CheckPoint
P. 69
6.3 Using frequency tables


               ✦     Exercise 6.3


               1  Here are the heights of 20 adults, measured to the nearest centimetre.

                     161    193   180    167    151    188   170    171    159   179
                     182    166   177    185    164    175   155    173    180   160

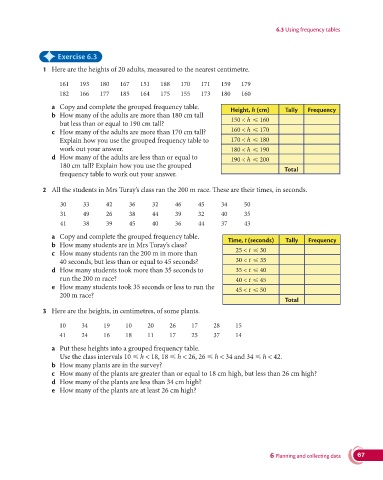
                  a  Copy and complete the grouped frequency table.
                                                                              Height, h (cm)    Tally   Frequency
                  b   How many of the adults are more than 180 cm tall
                     but less than or equal to 190 cm tall?                   150 < h    160
                  c  How many of the adults are more than 170 cm tall?        160 < h    170
                     Explain how you use the grouped frequency table to       170 < h    180
                     work out your answer.                                    180 < h    190
                  d   How many of the adults are less than or equal to        190 < h    200
                     180 cm tall? Explain how you use the grouped                               Total
                     frequency table to work out your answer.

               2  All the students in Mrs Turay’s class ran the 200 m race. These are their times, in seconds.

                     30      33     42      36      32     46      45      34     50
                     31      49     26      38      44     39      32      40     35
                     41      38     39      45      40     36      44      37     43

                  a  Copy and complete the grouped frequency table.          Time, t (seconds)  Tally   Frequency
                  b  How many students are in Mrs Turay’s class?
                  c   How many students ran the 200 m in more than              25 < t    30
                     40 seconds, but less than or equal to 45 seconds?          30 < t    35
                  d   How many students took more than 35 seconds to            35 < t    40
                     run the 200 m race?                                        40 < t    45
                  e   How many students took 35 seconds or less to run the      45 < t    50
                     200 m race?
                                                                                                Total
               3  Here are the heights, in centimetres, of some plants.

                     10     34      19     10     20      26     17     28      15
                     41     24      16     18     11      17     25     37      14

                  a  Put these heights into a grouped frequency table.
                    Use the class intervals 10   h < 18, 18   h < 26, 26   h < 34 and 34   h < 42.
                  b  How many plants are in the survey?
                  c  How many of the plants are greater than or equal to 18 cm high, but less than 26 cm high?
                  d  How many of the plants are less than 34 cm high?
                  e  How many of the plants are at least 26 cm high?


                                                                                           6 Planning and collecting data  67

