


Page 70 - MAT KS3 Y8 Cambridge CheckPoint
P. 70
6.3 Using frequency tables


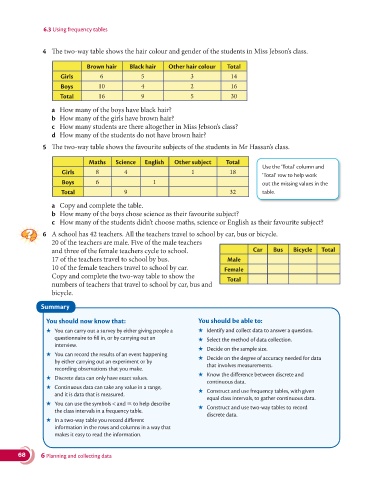
               4  The two-way table shows the hair colour and gender of the students in Miss Jebson’s class.

                              Brown hair    Black hair   Other hair colour   Total
                     Girls        6             5                3            14

                     Boys         10            4                2            16
                     Total        16            9                5            30
                  a  How many of the boys have black hair?
                  b  How many of the girls have brown hair?
                  c  How many students are there altogether in Miss Jebson’s class?
                  d  How many of the students do not have brown hair?
               5  The two-way table shows the favourite subjects of the students in Mr Hassan’s class.

                               Maths    Science  English   Other subject    Total
                                                                                        Use the ‘Total’ column and
                      Girls      8        4                      1            18
                                                                                        ‘Total’ row to help work
                      Boys       6                  1                                   out the missing values in the
                     Total                9                                   32        table.
                  a  Copy and complete the table.
                  b  How many of the boys chose science as their favourite subject?
                  c  How many of the students didn’t choose maths, science or English as their favourite subject?
               6   A school has 42 teachers. All the teachers travel to school by car, bus or bicycle.
                    20 of the teachers are male. Five of the male teachers
                  and three of the female teachers cycle to school.                  Car    Bus    Bicycle  Total
                  17 of the teachers travel to school by bus.                Male
                  10 of the female teachers travel to school by car.        Female
                    Copy and complete the two-way table to show the
                                                                             Total
                  numbers of teachers that travel to school by car, bus and
                  bicycle.

               Summary

                You should now know that:                          You should be able to:
                ★   You can carry out a survey by either giving people a   ★   Identify and collect data to answer a question.
                   questionnaire to fill in, or by carrying out an    ★   Select the method of data collection.
                   interview.
                                                                   ★   Decide on the sample size.
                ★   You can record the results of an event happening    ★
                   by either carrying out an experiment or by          Decide on the degree of accuracy needed for data
                                                                      that involves measurements.
                   recording observations that you make.
                                                                   ★   Know the difference between discrete and
                ★   Discrete data can only have exact values.
                                                                      continuous data.
                ★   Continuous data can take any value in a range,
                                                                   ★   Construct and use frequency tables, with given
                   and it is data that is measured.
                                                                      equal class intervals, to gather continuous data.
                ★   You can use the symbols < and   to help describe    ★
                   the class intervals in a frequency table.           Construct and use two-way tables to record
                                                                      discrete data.
                ★   In a two-way table you record different
                   information in the rows and columns in a way that
                   makes it easy to read the information.


       68      6 Planning and collecting data

