
Page 641 - Microeconomics, Fourth Edition
P. 641
c15riskandinformation.qxd 8/16/10 11:10 AM Page 615
15.2 EVALUATING RISKY OUTCOMES 615
expected values and is therefore indifferent between a sure thing and a lottery with the
same expected value. To see why, note that a risk-neutral decision maker has a linear
utility function, U a bI, where a is a nonnegative constant and b is a positive con-
2
stant. Consider a lottery with payoffs I 1 and I and associated probabilities p and 1 p.
The expected utility EU of the lottery is
EU p(a bI ) (1 p)(a bI )
1
2
a b[pI (1 p)I ]
1
2
The term in the square brackets is the expected value EV of the lottery, so EU a bEV.
Thus, when the expected value equals the payoff of the sure thing (i.e., when EV I),
the expected utility equals the utility of the sure thing (i.e., EU U).
Returning to our job offer example, we see that if you were risk neutral, you
would be indifferent between the sure $54,000 salary you would receive from the es-
tablished company and the expected salary of $54,000 associated with the offer from
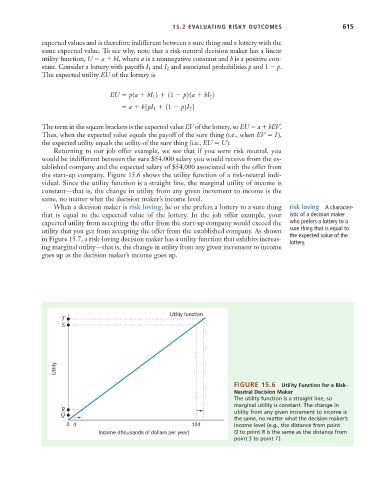
the start-up company. Figure 15.6 shows the utility function of a risk-neutral indi-
vidual. Since the utility function is a straight line, the marginal utility of income is
constant—that is, the change in utility from any given increment to income is the
same, no matter what the decision maker’s income level.
When a decision maker is risk loving, he or she prefers a lottery to a sure thing risk loving A character-
that is equal to the expected value of the lottery. In the job offer example, your istic of a decision maker
expected utility from accepting the offer from the start-up company would exceed the who prefers a lottery to a
utility that you get from accepting the offer from the established company. As shown sure thing that is equal to
in Figure 15.7, a risk-loving decision maker has a utility function that exhibits increas- the expected value of the
lottery.
ing marginal utility—that is, the change in utility from any given increment to income
goes up as the decision maker’s income goes up.
Utility function
T
S
Utility
FIGURE 15.6 Utility Function for a Risk-
Neutral Decision Maker
The utility function is a straight line, so
marginal utility is constant. The change in
R
Q utility from any given increment to income is
the same, no matter what the decision maker’s
0 4 104 income level (e.g., the distance from point
Income (thousands of dollars per year) Q to point R is the same as the distance from
point S to point T).