
Page 756 - Microeconomics, Fourth Edition
P. 756
BMappAMathematicalAppendix.qxd 8/17/10 1:10 AM Page 730
730 MATHEMATICAL APPENDIX
R
$16
Demand for paint:
two algebraic forms
P = 16 – 2Q
Q = 8 – 0.5P
S
12 ΔP = –2 T Slope of graph:
P, Price (dollars per liter) 10 ΔQ = +1 U V ΔQ = –2
ΔP
8
6
W
4
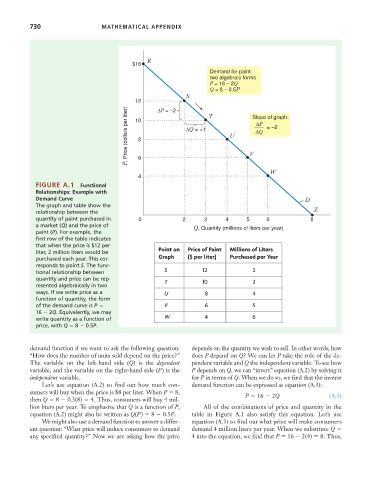
FIGURE A.1 Functional
Relationships: Example with
Demand Curve D
The graph and table show the Z
relationship between the
quantity of paint purchased in 0 2 3 4 5 6 8
a market (Q) and the price of Q, Quantity (millions of liters per year)
paint (P). For example, the
first row of the table indicates
that when the price is $12 per
liter, 2 million liters would be Point on Price of Paint Millions of Liters
purchased each year. This cor- Graph ($ per liter) Purchased per Year
responds to point S. The func-
tional relationship between S 12 2
quantity and price can be rep- T 10 3
resented algebraically in two
ways. If we write price as a U 8 4
function of quantity, the form
of the demand curve is P V 6 5
16 2Q. Equivalently, we may
write quantity as a function of W 4 6
price, with Q 8 0.5P.
demand function if we want to ask the following question: depends on the quantity we wish to sell. In other words, how
“How does the number of units sold depend on the price?” does P depend on Q? We can let P take the role of the de-
The variable on the left-hand side (Q) is the dependent pendent variable and Q the independent variable. To see how
variable, and the variable on the right-hand side (P) is the P depends on Q, we can “invert” equation (A.2) by solving it
independent variable. for P in terms of Q. When we do so, we find that the inverse
Let’s use equation (A.2) to find out how much con- demand function can be expressed as equation (A.3):
sumers will buy when the price is $8 per liter. When P 8,
then Q 8 0.5(8) 4. Thus, consumers will buy 4 mil- P 16 2Q (A.3)
lion liters per year. To emphasize that Q is a function of P, All of the combinations of price and quantity in the
equation (A.2) might also be written as Q(P) 8 0.5P. table in Figure A.1 also satisfy this equation. Let’s use
We might also use a demand function to answer a differ- equation (A.3) to find out what price will make consumers
ent question: “What price will induce consumers to demand demand 4 million liters per year. When we substitute Q
any specified quantity?” Now we are asking how the price 4 into the equation, we find that P 16 2(4) 8. Thus,