Page 758 - Microeconomics, Fourth Edition
P. 758

BMappAMathematicalAppendix.qxd  8/17/10  1:10 AM  Page 732


                  732                   MATHEMATICAL APPENDIX


                                                  $140                                       Total cost (C)


                                                   120
                                                                                      ΔQ = 1     Tangent line
                                                   100                                           at point B.
                                                                                             B   Slope = $28/unit
                                                 C, cost (dollars)  80  Tangent line   A
                                                                            ΔC = 21
                                                          at point E.
                                                    60
                                                          Slope = $12/unit
                                                    48
                                                                   E     Tangent line
                                                    40                   at point A.
                                                                         Slope = $15/unit
                                                    20


                                                     0      1     2     3      4      5     6     7
                                                                      Q, quantity (units)
                                                (a)

                                                   $50                                     Marginal cost (MC)


                                                    40   Average cost (AC)
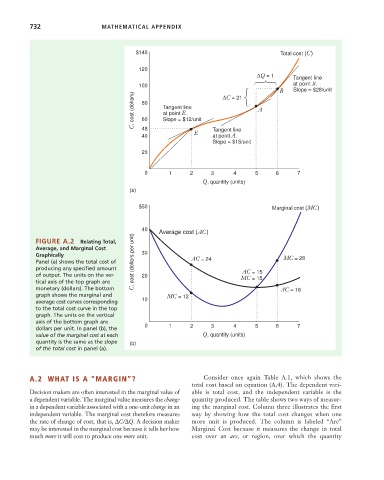
                    FIGURE A.2   Relating Total,
                    Average, and Marginal Cost
                    Graphically                     30                                        MC = 28
                    Panel (a) shows the total cost of  C, cost (dollars per unit)  AC = 24
                    producing any specified amount
                                                                                  AC = 15
                    of output. The units on the ver-  20                         MC = 15
                    tical axis of the top graph are
                    monetary (dollars). The bottom                                           AC = 16
                    graph shows the marginal and           MC = 12
                    average cost curves corresponding  10
                    to the total cost curve in the top
                    graph. The units on the vertical
                    axis of the bottom graph are
                    dollars per unit. In panel (b), the  0  1     2     3      4      5     6     7
                    value of the marginal cost at each                Q, quantity (units)
                    quantity is the same as the slope  (b)
                    of the total cost in panel (a).


                  A.2  WHAT IS A “MARGIN”?                            Consider once again Table A.1, which shows the
                                                                   total cost based on equation (A.4). The dependent vari-
                  Decision makers are often interested in the marginal value of  able is total cost, and the independent variable is the
                  a dependent variable. The marginal value measures the change  quantity produced. The table shows two ways of measur-
                  in a dependent variable associated with a one-unit change in an  ing the marginal cost. Column three illustrates the first
                  independent variable. The marginal cost therefore measures  way by showing how the total cost changes when one
                  the rate of change of cost, that is,  C/ Q. A decision maker  more unit is produced. The column is labeled “Arc”
                  may be interested in the marginal cost because it tells her how  Marginal Cost because it measures the change in total
                  much more it will cost to produce one more unit.  cost over an  arc, or region, over which the quantity
   753   754   755   756   757   758   759   760   761   762   763