Page 761 - Microeconomics, Fourth Edition
P. 761
BMappAMathematicalAppendix.qxd  8/17/10  1:10 AM  Page 735


                                                                 A.4 HOW TO FIND A DERIVATIVE                   735
                      ( x   x 3   x 1 ). Thus, the slope of  EF is  ¢y/¢x    book to learn more about derivatives, including derivatives
                      ( y 3   y 1 )/(x 3   x 1 ).  The graph indicates that the slope of  of other types of functions not included here.
                      EF will not exactly measure the slope of the tangent line at
                      E, but it does give us an approximation of the slope. As the
                                                                      Derivative of a Constant
                      graph is drawn, the slope of EF will be less than the slope of
                                                                      If the dependent variable y is a constant, its derivative with
                      the line tangent to the function at point E.
                         We can get a better approximation to the slope at E if  respect to x is zero. In other words, suppose y   k, where k
                                                                      is a constant. Then dy/dx   0 .
                      we choose another point on the graph closer to E, such as
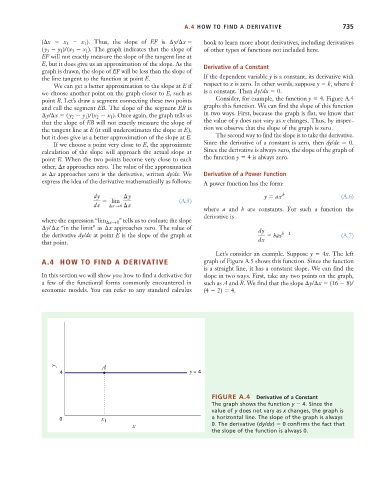
                                                                          Consider, for example, the function y   4. Figure A.4
                      point B. Let’s draw a segment connecting these two points
                      and call the segment EB. The slope of the segment EB is  graphs this function. We can find the slope of this function
                      ¢y/¢x   ( y 2   y 1 )/(x 2   x 1 ).  Once again, the graph tells us  in two ways. First, because the graph is flat, we know that
                      that the slope of EB will not exactly measure the slope of  the value of y does not vary as x changes. Thus, by inspec-
                      the tangent line at E (it still underestimates the slope at E),  tion we observe that the slope of the graph is zero.
                      but it does give us a better approximation of the slope at E.  The second way to find the slope is to take the derivative.
                         If we choose a point very close to E, the approximate  Since the derivative of a constant is zero, then  dy/dx   0.
                      calculation of the slope will approach the actual slope at  Since the derivative is always zero, the slope of the graph of
                      point E. When the two points become very close to each  the function y   4 is always zero.
                      other,  x approaches zero. The value of the approximation
                      as  x approaches zero is the derivative, written dy dx. We  Derivative of a Power Function
                      express the idea of the derivative mathematically as follows:
                                                                      A power function has the form:
                                     dy       ¢ y                                        y   ax  b              (A.6)
                                          lim                  (A.5)
                                     dx   ¢x S0 ¢x
                                                                      where  a and  b are constants. For such a function the
                                                                      derivative is
                                             ” tells us to evaluate the slope
                      where the expression “lim ¢xS0
                      ¢y/¢x  “in the limit” as ¢x  approaches zero. The value of       dy
                      the derivative dy/dx at point E is the slope of the graph at         bax b 1              (A.7)
                      that point.                                                      dx
                                                                          Let’s consider an example. Suppose y   4x. The left
                      A.4  HOW TO FIND A DERIVATIVE                   graph of Figure A.5 shows this function. Since the function
                                                                      is a straight line, it has a constant slope. We can find the
                      In this section we will show you how to find a derivative for  slope in two ways. First, take any two points on the graph,
                      a few of the functional forms commonly encountered in  such as A and B. We find that the slope  y/ x   (16   8)/
                      economic models. You can refer to any standard calculus  (4   2)   4.


                          y             A
                           4                                      y = 4


                                                                         FIGURE A.4   Derivative of a Constant
                                                                         The graph shows the function y   4. Since the
                                                                         value of y does not vary as x changes, the graph is
                           0            x                                a horizontal line. The slope of the graph is always
                                        1
                                                 x                       0. The derivative (dy/dx)   0 confirms the fact that
                                                                         the slope of the function is always 0.

