
Page 82 - GuardII+ Series 4208 Platform PD User Manual
P. 82
Troubleshooting
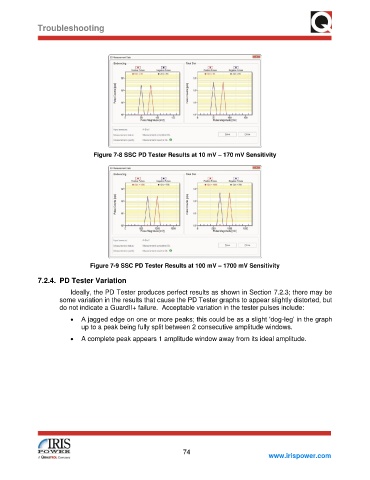
Figure 7-8 SSC PD Tester Results at 10 mV – 170 mV Sensitivity
Figure 7-9 SSC PD Tester Results at 100 mV – 1700 mV Sensitivity
7.2.4. PD Tester Variation
Ideally, the PD Tester produces perfect results as shown in Section 7.2.3; there may be
some variation in the results that cause the PD Tester graphs to appear slightly distorted, but
do not indicate a GuardII+ failure. Acceptable variation in the tester pulses include:
• A jagged edge on one or more peaks; this could be as a slight ‘dog-leg’ in the graph
up to a peak being fully split between 2 consecutive amplitude windows.
• A complete peak appears 1 amplitude window away from its ideal amplitude.
74
www.irispower.com