
Page 186 - Civil Engineering Project Management, Fourth Edition
P. 186
Civil Engineering Project Management
168
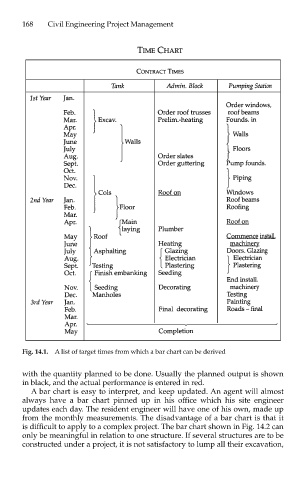
Fig. 14.1. A list of target times from which a bar chart can be derived
with the quantity planned to be done. Usually the planned output is shown
in black, and the actual performance is entered in red.
A bar chart is easy to interpret, and keep updated. An agent will almost
always have a bar chart pinned up in his office which his site engineer
updates each day. The resident engineer will have one of his own, made up
from the monthly measurements. The disadvantage of a bar chart is that it
is difficult to apply to a complex project. The bar chart shown in Fig. 14.2 can
only be meaningful in relation to one structure. If several structures are to be
constructed under a project, it is not satisfactory to lump all their excavation,