
Page 189 - Civil Engineering Project Management, Fourth Edition
P. 189
Civil Engineering Project Management
170
concreting, brickwork quantities etc. together. However, if there are only a
few structures to deal with, bar charts for each will be practicable.
An alternative is to use a computer to display bar charts at several levels
of detail. For resource planning and material ordering purposes the detailed
operations required for each structure can be shown on one chart, and these
can be summarized into one bar on another bar chart, which in turn can be
used to represent progress on the project as a whole. Critical linkages between
operations can be fed into the program as for network diagrams (see Section
14.5 ), and the resulting critical paths and ‘floats’ can be derived. Adjustment
to a detailed bar chart – perhaps due to some delay or extra work – is auto-
matically reflected in the overall summary bar chart display. Of course the
operation of such software requires investment in the time and the use of skilled
operators, so the cost may only be justified for a large complicated project.
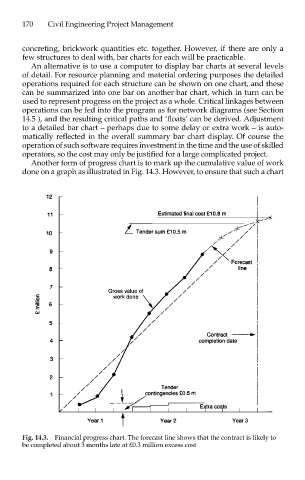
Another form of progress chart is to mark up the cumulative value of work
done on a graph as illustrated in Fig. 14.3. However, to ensure that such a chart
Fig. 14.3. Financial progress chart. The forecast line shows that the contract is likely to
be completed about 3 months late at £0.3 million excess cost