
Page 191 - Civil Engineering Project Management, Fourth Edition
P. 191
Civil Engineering Project Management
172
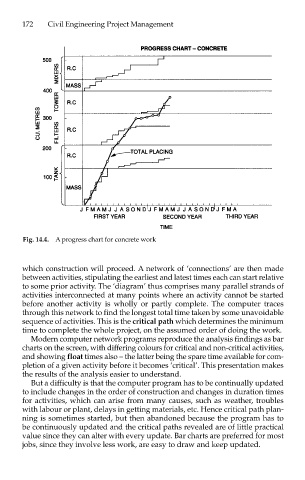
Fig. 14.4. A progress chart for concrete work
which construction will proceed. A network of ‘connections’ are then made
between activities, stipulating the earliest and latest times each can start relative
to some prior activity. The ‘diagram’ thus comprises many parallel strands of
activities interconnected at many points where an activity cannot be started
before another activity is wholly or partly complete. The computer traces
through this network to find the longest total time taken by some unavoidable
sequence of activities. This is the critical path which determines the minimum
time to complete the whole project, on the assumed order of doing the work.
Modern computer network programs reproduce the analysis findings as bar
charts on the screen, with differing colours for critical and non-critical activities,
and showing float times also – the latter being the spare time available for com-
pletion of a given activity before it becomes ‘critical’. This presentation makes
the results of the analysis easier to understand.
But a difficulty is that the computer program has to be continually updated
to include changes in the order of construction and changes in duration times
for activities, which can arise from many causes, such as weather, troubles
with labour or plant, delays in getting materials, etc. Hence critical path plan-
ning is sometimes started, but then abandoned because the program has to
be continuously updated and the critical paths revealed are of little practical
value since they can alter with every update. Bar charts are preferred for most
jobs, since they involve less work, are easy to draw and keep updated.