Page 191 - RFHL ANNUAL REPORT 2025 ONLINE_NEW
P. 191

•  189


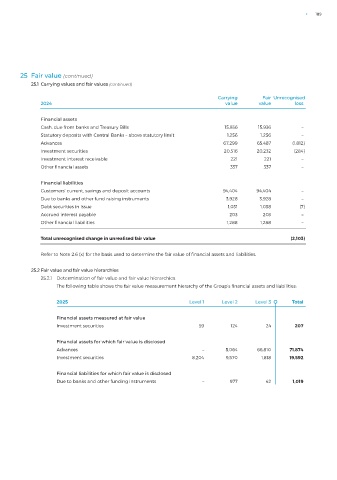
        25  Fair value (continued)
            25.1  Carrying values and fair values (continued)


                                                                              Carrying        Fair  Unrecognised
               2024                                                              value       value       loss

               Financial assets
               Cash, due from banks and Treasury Bills                           15,936      15,936         –
               Statutory deposits with Central Banks – above statutory limit       1,256     1,256          –
               Advances                                                         67,299      65,487       (1,812)
               Investment securities                                             20,516     20,232       (284)
               Investment interest receivable                                      221         221          –
               Other financial assets                                              337         337          –

               Financial liabilities
               Customers’ current, savings and deposit accounts                 94,404      94,404          –
               Due to banks and other fund raising instruments                   3,928       3,928          –
               Debt securities in issue                                           1,031      1,038         (7)
               Accrued interest payable                                           203         203           –
               Other financial liabilities                                        1,288      1,288          –

                 Total unrecognised change in unrealised fair value                                    (2,103)

               Refer to Note 2.6 (x) for the basis used to determine the fair value of financial assets and liabilities.


            25.2 Fair value and fair value hierarchies
               25.2.1  Determination of fair value and fair value hierarchies
                       The following table shows the fair value measurement hierarchy of the Group’s financial assets and liabilities:


                     2025                                           Level 1     Level 2     Level 3      Total

                       Financial assets measured at fair value
                     Investment securities                              59         124         24         207

                     Financial assets for which fair value is disclosed
                     Advances                                            –       5,064      66,810      71,874
                     Investment securities                           8,204       9,570        1,818     19,592

                     Financial liabilities for which fair value is disclosed
                     Due to banks and other funding instruments          –         977         42        1,019
   186   187   188   189   190   191   192   193   194   195   196