
Page 196 - RFHL ANNUAL REPORT 2025 ONLINE_NEW
P. 196
194 • Republic Financial Holdings Limited 2025 Annual Report • FINANCIALS
Notes to the Consolidated Financial Statements
For the year ended September 30, 2025. Expressed in millions of Trinidad and Tobago dollars, except where otherwise stated.
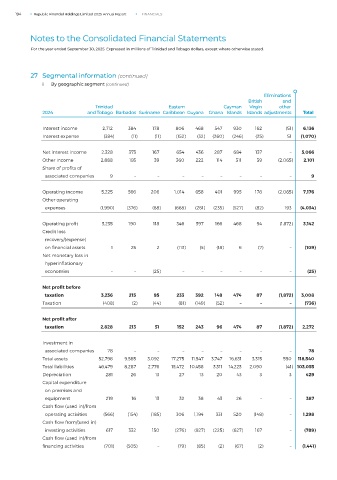
27 Segmental information (continued)
i By geographic segment (continued)
Eliminations
British and
Trinidad Eastern Cayman Virgin other
2024 and Tobago Barbados Suriname Caribbean Guyana Ghana Islands Islands adjustments Total
Interest income 2,712 384 178 806 468 547 930 162 (51) 6,136
Interest expense (384) (11) (11) (152) (32) (260) (246) (25) 51 (1,070)
Net interest income 2,328 373 167 654 436 287 684 137 – 5,066
Other income 2,888 193 39 360 222 114 311 39 (2,065) 2,101
Share of profits of
associated companies 9 – – – – – – – – 9
Operating income 5,225 566 206 1,014 658 401 995 176 (2,065) 7,176
Other operating
expenses (1,990) (376) (88) (668) (261) (235) (527) (82) 193 (4,034)
Operating profit 3,235 190 118 346 397 166 468 94 (1,872) 3,142
Credit loss
recovery/(expense)
on financial assets 1 25 2 (113) (5) (18) 6 (7) – (109)
Net monetary loss in
hyperinflationary
economies – – (25) – – – – – – (25)
Net profit before
taxation 3,236 215 95 233 392 148 474 87 (1,872) 3,008
Taxation (408) (2) (44) (81) (149) (52) – – – (736)
Net profit after
taxation 2,828 213 51 152 243 96 474 87 (1,872) 2,272
Investment in
associated companies 78 – – – – – – – – 78
Total assets 52,798 9,585 3,092 17,275 11,547 3,747 16,631 3,315 550 118,540
Total liabilities 46,479 8,287 2,776 15,472 10,458 3,311 14,223 2,090 (41) 103,055
Depreciation 281 26 13 27 13 20 43 3 3 429
Capital expenditure
on premises and
equipment 219 16 13 32 38 43 26 – – 387
Cash flow (used in)/from
operating activities (566) (154) (185) 306 1,194 331 520 (148) – 1,298
Cash flow from/(used in)
investing activities 617 332 150 (276) (927) (225) (627) 167 – (789)
Cash flow (used in)/from
financing activities (701) (505) – (79) (85) (2) (67) (2) – (1,441)