
Page 195 - RFHL ANNUAL REPORT 2025 ONLINE_NEW
P. 195
• 193
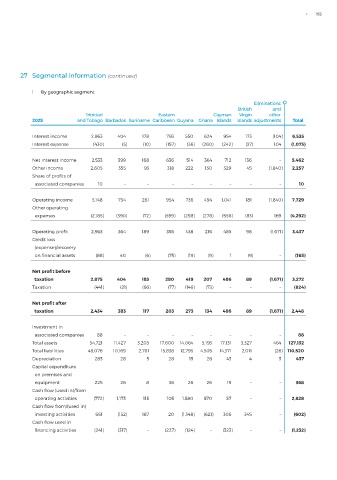
27 Segmental information (continued)
i By geographic segment
Eliminations
British and
Trinidad Eastern Cayman Virgin other
2025 and Tobago Barbados Suriname Caribbean Guyana Ghana Islands Islands adjustments Total
Interest income 2,963 404 178 793 550 624 954 173 (104) 6,535
Interest expense (430) (5) (10) (157) (36) (260) (242) (37) 104 (1,073)
Net interest income 2,533 399 168 636 514 364 712 136 – 5,462
Other income 2,605 355 93 318 222 130 329 45 (1,840) 2,257
Share of profits of
associated companies 10 – – – – – – – – 10
Operating income 5,148 754 261 954 736 494 1,041 181 (1,840) 7,729
Other operating
expenses (2,185) (390) (72) (599) (298) (278) (556) (83) 169 (4,292)
Operating profit 2,963 364 189 355 438 216 485 98 (1,671) 3,437
Credit loss
(expense)/recovery
on financial assets (88) 40 (6) (75) (19) (9) 1 (9) – (165)
Net profit before
taxation 2,875 404 183 280 419 207 486 89 (1,671) 3,272
Taxation (441) (21) (66) (77) (146) (73) – – – (824)
Net profit after
taxation 2,434 383 117 203 273 134 486 89 (1,671) 2,448
Investment in
associated companies 88 – – – – – – – – 88
Total assets 54,721 11,427 3,205 17,600 14,064 5,193 17,131 3,327 464 127,132
Total liabilities 48,076 10,169 2,781 15,838 12,795 4,505 14,371 2,011 (26) 110,520
Depreciation 283 28 5 28 15 28 43 4 3 437
Capital expenditure
on premises and
equipment 225 26 8 38 26 26 19 – – 368
Cash flow (used in)/from
operating activities (772) 1,173 115 105 1,580 570 57 – – 2,828
Cash flow from/(used in)
investing activities 661 (152) 187 20 (1,348) (621) 306 345 – (602)
Cash flow used in
financing activities (241) (317) – (227) (124) – (323) – – (1,232)