
Page 4 - sackcasestudy
P. 4
3
CTA
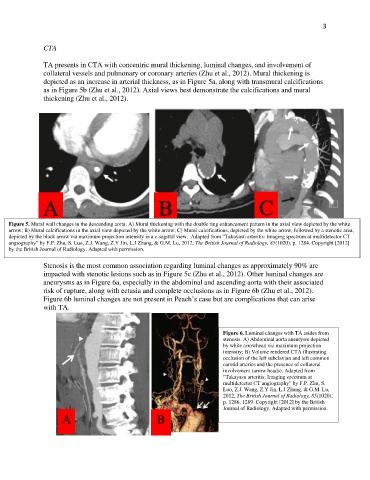
TA presents in CTA with concentric mural thickening, luminal changes, and involvement of
collateral vessels and pulmonary or coronary arteries (Zhu et al., 2012). Mural thickening is
depicted as an increase in arterial thickness, as in Figure 5a, along with transmural calcifications
as in Figure 5b (Zhu et al., 2012). Axial views best demonstrate the calcifications and mural
thickening (Zhu et al., 2012).
A B C
Figure 5. Mural wall changes in the descending aorta. A) Mural thickening with the double ring enhancement pattern in the axial view depicted by the white
arrow; B) Mural calcifications in the axial view depicted by the white arrow; C) Mural calcifications, depicted by the white arrow, followed by a stenotic area,
depicted by the black arrow via maximum projection intensity in a c-sagittal view. Adapted from “Takayasu arteritis: Imaging spectrum at multidetector CT
angiography” by F.P. Zhu, S. Luo, Z.J. Wang, Z.Y Jin, L.J Zhang, & G.M. Lu, 2012, The British Journal of Radiology, 85(1020), p. 1284. Copyright [2012]
by the British Journal of Radiology. Adapted with permission.
Stenosis is the most common association regarding luminal changes as approximately 90% are
impacted with stenotic lesions such as in Figure 5c (Zhu et al., 2012). Other luminal changes are
aneurysms as in Figure 6a, especially in the abdominal and ascending aorta with their associated
risk of rupture, along with ectasia and complete occlusions as in Figure 6b (Zhu et al., 2012).
Figure 6b luminal changes are not present in Peach’s case but are complications that can arise
with TA.
Figure 6. Luminal changes with TA asides from
stenosis. A) Abdominal aorta aneurysm depicted
by white arrowhead via maximum projection
intensity; B) Volume rendered CTA illustrating
occlusion of the left subclavian and left common
carotid arteries and the presence of collateral
involvement (arrow heads). Adapted from
“Takayasu arteritis: Imaging spectrum at
multidetector CT angiography” by F.P. Zhu, S.
Luo, Z.J. Wang, Z.Y Jin, L.J Zhang, & G.M. Lu,
2012, The British Journal of Radiology, 85(1020),
p. 1286, 1289. Copyright [2012] by the British
Journal of Radiology. Adapted with permission.
A B