
Page 5 - sackcasestudy
P. 5
4
Volume rendering is best used to demonstrate the involvement of collateral vessels, as in figure
6b, and visualizing the pulmonary and coronary arteries. For example, in Figure 7, volume
rendered CTA illustrates a stenosis in the right pulmonary trunk leading to decreased perfusion
(Zhu et al., 2012). The differential diagnosis for TA with CTA include polyarteritis nodosa, giant
cell arteritis, and atherosclerosis (Zhu et al., 2012).
Figure 7. Volume rendered CTA of pulmonary
arteries. Arrow pointing to right pulmonary artery
stenosis. Adapted from “Takayasu arteritis: Imaging
spectrum at multidetector CT angiography” by F.P.
Zhu, S. Luo, Z.J. Wang, Z.Y Jin, L.J Zhang, & G.M.
Lu, 2012, The British Journal of Radiology,
85(1020), p. 1289. Copyright [2012] by the British
Journal of Radiology. Adapted with permission.
PET
PET is a nuclear medicine imaging modality used in TA by looking for increased metabolic
activity regarding glucose uptake (Mavrogeni et al., 2013). Prior to this study, Peach must fast
for at least six hours, along with avoiding exercise for a day (Mavrogeni et al., 2013). The
radioisotope used for TA detection is 18F-Fluorodeoxyglucose (18F-FDG) (Mavrogeni et al.,
2013). After 18F-FDG injection, a positive result showing active vasculitis presents as an intense
linear uptake of FDG, as large vessels uptake more glucose with inflammation (Mavrogeni et al.,
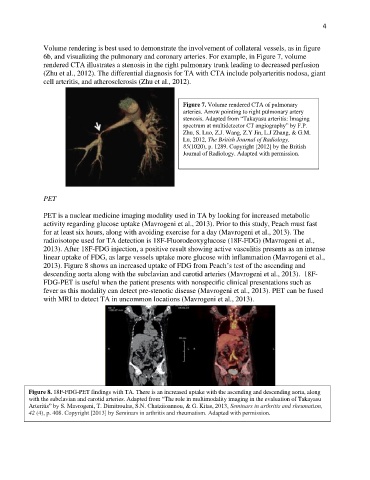
2013). Figure 8 shows an increased uptake of FDG from Peach’s test of the ascending and
descending aorta along with the subclavian and carotid arteries (Mavrogeni et al., 2013). 18F-
FDG-PET is useful when the patient presents with nonspecific clinical presentations such as
fever as this modality can detect pre-stenotic disease (Mavrogeni et al., 2013). PET can be fused
with MRI to detect TA in uncommon locations (Mavrogeni et al., 2013).
Figure 8. 18F-FDG-PET findings with TA. There is an increased uptake with the ascending and descending aorta, along
with the subclavian and carotid arteries. Adapted from “The role in multimodality imaging in the evaluation of Takayasu
Arteritis” by S. Mavrogeni, T. Dimitroulas, S.N. Chatziioannou, & G. Kitas, 2013, Seminars in arthritis and rheumatism,
42 (4), p. 408. Copyright [2013] by Seminars in arthritis and rheumatism. Adapted with permission.