
Page 62 - Pengurusan Prestasi Nilai Teras POISE UM
P. 62
To examine item compatibility, TF11 reviewed the outfit MNSQ
value for all items. The outfit MNSQ value is the sensitivity value
corresponding with item difficulty. At this stage, ten items had to be
removed for not meeting the outfit MNSQ value. Outfit MNSQ statistics
with a range of 0.5 to 1.5 are the range values often used for Rasch
analysis rating scale. The value of this outfit is based on a reference to
Bond and Fox (2015). The number of the remaining items was 26.
Next, item polarity analysis was reviewed to see that all items move in
one direction. Findings showed that PTMEA CORR (PT Measure Corr)
readings for all 26 items were positive. This shows that the remaining
items measured the dimensions involved (Bond and Fox, 2015).
Several items were eliminated when the logit Measure values were
reviewed. There were a few item groups that were found to overlap
and had the same or not significantly different levels of difficulty. Thus,
TF11 removed the items, which tested the same construct. In addition,
there were also items that were eliminated for having relatively high
standard error (Model S.E) values. As a result of the removal of items,
15 NTP items were retained.
62 5.1 Unidimensionality and Rating Scale
Analysis
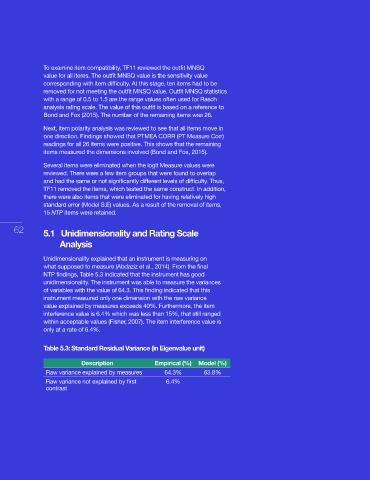
Unidimensionality explained that an instrument is measuring on
what supposed to measure (Abdaziz et al., 2014). From the final
NTP findings, Table 5.3 indicated that the instrument has good
unidimensionality. The instrument was able to measure the variances
of variables with the value of 64.3. This finding indicated that this
instrument measured only one dimension with the raw variance
value explained by measures exceeds 40%. Furthermore, the item
interference value is 6.4% which was less than 15%, that still ranged
within acceptable values (Fisher, 2007). The item interference value is
only at a rate of 6.4%.
Table 5.3: Standard Residual Variance (in Eigenvalue unit)
Description Empirical (%) Model (%)
Raw variance explained by measures 64.3% 63.8%
Raw variance not explained by first 6.4%
contrast