
Page 55 - Small Animal Internal Medicine, 6th Edition
P. 55
CHAPTER 2 Diagnostic Tests for the Cardiovascular System 27
Systolic time intervals (STIs) have been used sporadically timing. The common STIs are: LV ejection time (duration
to estimate cardiac function, but they also are influenced by of time the aortic valve is open), preejection period (time
VetBooks.ir cardiac filling and afterload. These intervals can be calcu- from the onset of the QRS to aortic valve opening), and
total electromechanical systole (LV ejection time plus pre-
lated if the opening and closing of the aortic valve are clearly
ejection period). STIs also can be derived using Doppler
seen on M-mode and a simultaneous ECG is recorded for
echocardiography.
CONTRAST ECHOCARDIOGRAPHY
This technique, often called a “bubble study,” uses rapid
injection of a substance containing “microbubbles” either
into a peripheral vein or selectively into the heart. These
microbubbles generate tiny pinpoint echoes that tempo-
rarily “opacify” the blood pool being imaged (Fig. 2.13).
The microbubbles appear as bright sparkles moving with
the blood flow. Agitated sterile saline solution, a mixture
of saline and the patient’s blood, and commercial echo-
contrast agents can be used as echo-contrast material. After
injection into a peripheral vein, bubbles appear in the right
heart chambers. Bubbles seen in the left heart or aorta indi-
cate a right-to-left shunt. Saline microbubbles do not pass
through the pulmonary capillaries (although some com-
mercially available echo-contrast agents do), so agitated
saline-contrast injection via selective left-sided heart cath-
eterization is required to visualize intracardiac left-to-right
shunts or mitral regurgitation. Doppler echocardiography
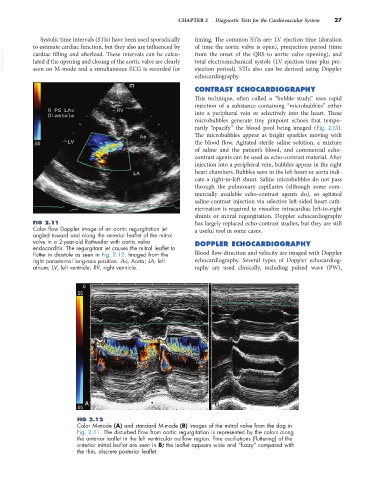
FIG 2.11 has largely replaced echo-contrast studies, but they are still
Color flow Doppler image of an aortic regurgitation jet a useful tool in some cases.
angled toward and along the anterior leaflet of the mitral
valve in a 2-year-old Rottweiler with aortic valve DOPPLER ECHOCARDIOGRAPHY
endocarditis. The regurgitant jet causes the mitral leaflet to
flutter in diastole as seen in Fig. 2.12. Imaged from the Blood flow direction and velocity are imaged with Doppler
right parasternal long-axis position. Ao, Aorta; LA, left echocardiography. Several types of Doppler echocardiog-
atrium; LV, left ventricle; RV, right ventricle. raphy are used clinically, including pulsed wave (PW),
0
.55
A B
.55
FIG 2.12
Color M-mode (A) and standard M-mode (B) images of the mitral valve from the dog in
Fig. 2.11. The disturbed flow from aortic regurgitation is represented by the colors along
the anterior leaflet in the left ventricular outflow region. Fine oscillations (fluttering) of the
anterior mitral leaflet are seen in B; the leaflet appears wide and “fuzzy” compared with
the thin, discrete posterior leaflet.