
Page 56 - Small Animal Internal Medicine, 6th Edition
P. 56
28 PART I Cardiovascular System Disorders
2-D imaging. Calculated blood flow velocity diminishes as
the angle of incidence between the Doppler ultrasound beam
VetBooks.ir and direction of blood flow diverges from 0 degrees. This is
because the calculated flow velocity is inversely related to
the cosine of this angle (cosine 0 degrees = 1). As long as the
angle between the ultrasound beam and path of blood flow
is less than 20 degrees, maximal flow velocity can be esti-
mated with reasonable accuracy. As the angle of incidence
increases, the calculated velocity decreases. At an angle of
90 degrees, the calculated velocity is 0 (cosine 90 degrees =
0); therefore no flow signal is recorded when the ultrasound
beam is perpendicular to blood flow. Flow signals usually
are displayed with time on the x axis and velocity (scaled in
m/sec or cm/sec) on the y axis. A zero baseline demarcates
flow direction away from (below baseline) or toward (above
baseline) the transducer. Higher velocities are displayed
farther from baseline. Other flow characteristics (such as
turbulence) also affect the Doppler spectral display.
Pulsed Wave Doppler
PW Doppler uses short bursts of ultrasound to analyze
echoes returned from a specified area (designated the sample
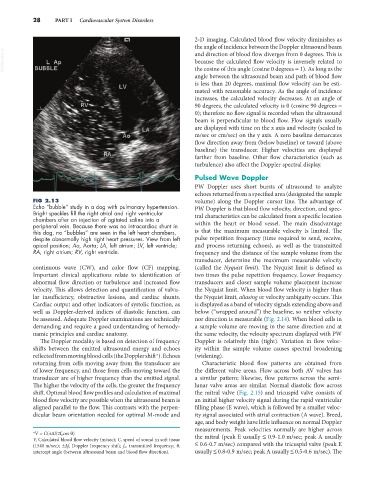
FIG 2.13 volume) along the Doppler cursor line. The advantage of
Echo “bubble” study in a dog with pulmonary hypertension. PW Doppler is that blood flow velocity, direction, and spec-
Bright speckles fill the right atrial and right ventricular tral characteristics can be calculated from a specific location
chambers after an injection of agitated saline into a within the heart or blood vessel. The main disadvantage
peripheral vein. Because there was no intracardiac shunt in
this dog, no “bubbles” are seen in the left heart chambers, is that the maximum measurable velocity is limited. The
despite abnormally high right heart pressures. View from left pulse repetition frequency (time required to send, receive,
apical position; Ao, Aorta; LA, left atrium; LV, left ventricle; and process returning echoes), as well as the transmitted
RA, right atrium; RV, right ventricle. frequency and the distance of the sample volume from the
transducer, determine the maximum measurable velocity
continuous wave (CW), and color flow (CF) mapping. (called the Nyquist limit). The Nyquist limit is defined as
Important clinical applications relate to identification of two times the pulse repetition frequency. Lower frequency
abnormal flow direction or turbulence and increased flow transducers and closer sample volume placement increase
velocity. This allows detection and quantification of valvu- the Nyquist limit. When blood flow velocity is higher than
lar insufficiency, obstructive lesions, and cardiac shunts. the Nyquist limit, aliasing or velocity ambiguity occurs. This
Cardiac output and other indicators of systolic function, as is displayed as a band of velocity signals extending above and
well as Doppler-derived indices of diastolic function, can below (“wrapped around”) the baseline, so neither velocity
be assessed. Adequate Doppler examinations are technically nor direction is measurable (Fig. 2.14). When blood cells in
demanding and require a good understanding of hemody- a sample volume are moving in the same direction and at
namic principles and cardiac anatomy. the same velocity, the velocity spectrum displayed with PW
The Doppler modality is based on detection of frequency Doppler is relatively thin (tight). Variation in flow veloc-
shifts between the emitted ultrasound energy and echoes ity within the sample volume causes spectral broadening
reflected from moving blood cells (the Doppler shift*). Echoes (widening).
returning from cells moving away from the transducer are Characteristic blood flow patterns are obtained from
of lower frequency, and those from cells moving toward the the different valve areas. Flow across both AV valves has
transducer are of higher frequency than the emitted signal. a similar pattern; likewise, flow patterns across the semi-
The higher the velocity of the cells, the greater the frequency lunar valve areas are similar. Normal diastolic flow across
shift. Optimal blood flow profiles and calculation of maximal the mitral valve (Fig. 2.15) and tricuspid valve consists of
blood flow velocity are possible when the ultrasound beam is an initial higher velocity signal during the rapid ventricular
aligned parallel to the flow. This contrasts with the perpen- filling phase (E wave), which is followed by a smaller veloc-
dicular beam orientation needed for optimal M-mode and ity signal associated with atrial contraction (A wave). Breed,
age, and body weight have little influence on normal Doppler
measurements. Peak velocities normally are higher across
*V = C(±Δf/2f 0 cos θ) the mitral (peak E usually ≤ 0.9-1.0 m/sec; peak A usually
V, Calculated blood flow velocity (m/sec); C, speed of sound in soft tissue
(1540 m/sec); ±Δf, Doppler frequency shift; f 0 , transmitted frequency; θ, ≤ 0.6-0.7 m/sec) compared with the tricuspid valve (peak E
intercept angle (between ultrasound beam and blood flow direction). usually ≤ 0.8-0.9 m/sec; peak A usually ≤ 0.5-0.6 m/sec). The