
Page 199 - Clinical Small Animal Internal Medicine
P. 199
17 Electrocardiography 167
Table 17.2 Electrode position for ECG recording in dogs and cats complex
QRS
VetBooks.ir ECG electrode Position R
Black Left front leg at elbow
White Right font leg at elbow
Red Left back leg at stifle
Green Right back leg at stifle
ST
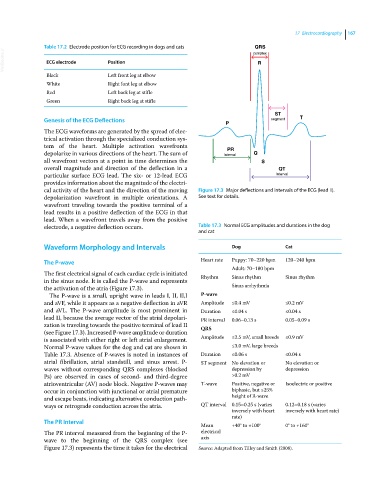
Genesis of the ECG Deflections segment T
P
The ECG waveforms are generated by the spread of elec-
trical activation through the specialized conduction sys-
tem of the heart. Multiple activation wavefronts PR
depolarize in various directions of the heart. The sum of Interval Q
all wavefront vectors at a point in time determines the S
overall magnitude and direction of the deflection in a QT
particular surface ECG lead. The six‐ or 12‐lead ECG Interval
provides information about the magnitude of the electri-
cal activity of the heart and the direction of the moving Figure 17.3 Major deflections and intervals of the ECG (lead II).
depolarization wavefront in multiple orientations. A See text for details.
wavefront traveling towards the positive terminal of a
lead results in a positive deflection of the ECG in that
lead. When a wavefront travels away from the positive
electrode, a negative deflection occurs. Table 17.3 Normal ECG amplitudes and durations in the dog
and cat
Waveform Morphology and Intervals Dog Cat
The P‐wave Heart rate Puppy: 70–220 bpm 120–240 bpm
Adult: 70–180 bpm
The first electrical signal of each cardiac cycle is initiated Rhythm Sinus rhythm Sinus rhythm
in the sinus node. It is called the P‐wave and represents
the activation of the atria (Figure 17.3). Sinus arrhythmia
The P‐wave is a small, upright wave in leads I, II, II,I P‐wave
and aVF, while it appears as a negative deflection in aVR Amplitude ≤0.4 mV ≤0.2 mV
and aVL. The P‐wave amplitude is most prominent in Duration ≤0.04 s ≤0.04 s
lead II, because the average vector of the atrial depolari- PR interval 0.06–0.13 s 0.05–0.09 s
zation is traveling towards the positive terminal of lead II
(see Figure 17.3). Increased P‐wave amplitude or duration QRS
is associated with either right or left atrial enlargement. Amplitude ≤2.5 mV, small breeds ≤0.9 mV
Normal P‐wave values for the dog and cat are shown in ≤3.0 mV, large breeds
Table 17.3. Absence of P‐waves is noted in instances of Duration ≤0.06 s ≤0.04 s
atrial fibrillation, atrial standstill, and sinus arrest. P‐ ST segment No elevation or No elevation or
waves without corresponding QRS complexes (blocked depression by depression
Ps) are observed in cases of second‐ and third‐degree >0.2 mV
atrioventricular (AV) node block. Negative P‐waves may T‐wave Positive, negative or Isoelectric or positive
occur in conjunction with junctional or atrial premature biphasic, but ≤25%
and escape beats, indicating alternative conduction path- height of R‐wave
ways or retrograde conduction across the atria. QT interval 0.15–0.25 s (varies 0.12–0.18 s (varies
inversely with heart inversely with heart rate)
rate)
The PR Interval
Mean +40° to +100° 0° to +160°
The PR interval measured from the beginning of the P‐ electrical
wave to the beginning of the QRS complex (see axis
Figure 17.3) represents the time it takes for the electrical Source: Adapted from Tilley and Smith (2008).