
Page 35 - Essential Haematology
P. 35
Chapter 2 Erythropoiesis and anaemia / 21
100
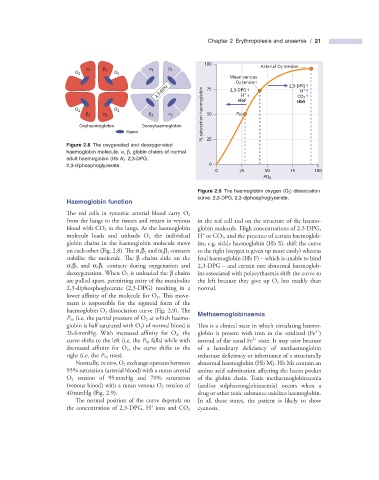
α β α β Arterial O 2 tension
O 2 1 1 O 2 1 1
Mean venous
O 2 tension 2,3-DPG
2,3-DPG 75 2,3-DPG + CO 2 +
H
H
O 2 O 2 HbF HbS
β 2 α 2 β 2 α 2 % saturation haemoglobin 50 P 50
Oxyhaemoglobin Deoxyhaemoglobin
Haem
Figure 2.8 The oxygenated and deoxygenated 25
haemoglobin molecule. α , β , globin chains of normal
adult haemoglobin (Hb A). 2,3 - DPG,
2,3 - diphosphoglycerate. 0
0 25 50 75 100
PO 2
Figure 2.9 The haemoglobin oxygen (O 2 ) dissociation
curve. 2,3 - DPG, 2,3 - diphosphoglycerate.
Haemoglobin f unction
The red cells in systemic arterial blood carry O 2
from the lungs to the tissues and return in venous in the red cell and on the structure of the haemo-
blood with CO 2 to the lungs. As the haemoglobin globin molecule. High concentrations of 2,3 - DPG,
+
molecule loads and unloads O 2 the individual H or CO 2 , and the presence of certain haemoglob-
globin chains in the haemoglobin molecule move ins, e.g. sickle haemoglobin (Hb S), shift the curve
on each other (Fig. 2.8 ). Th e α 1 β 1 and α 2 β 2 contacts to the right (oxygen is given up more easily) whereas
stabilize the molecule. Th e β chains slide on the fetal haemoglobin (Hb F) – which is unable to bind
α 1 β 2 and α 2 β 1 contacts during oxygenation and 2,3 - DPG – and certain rare abnormal haemoglob-
deoxygenation. When O 2 is unloaded the β chains ins associated with polycythaemia shift the curve to
are pulled apart, permitting entry of the metabolite the left because they give up O 2 less readily than
2,3 - diphosphoglycerate (2,3 - DPG) resulting in a normal.
lower affinity of the molecule for O 2 . Th is move-
ment is responsible for the sigmoid form of the
haemoglobin O 2 dissociation curve (Fig. 2.9 ). Th e Methaemoglobinaemia
P 50 (i.e. the partial pressure of O 2 at which haemo-
globin is half saturated with O 2 ) of normal blood is Th is is a clinical state in which circulating haemo-
3 +
26.6 mmHg. With increased affi nity for O 2 , the globin is present with iron in the oxidized (Fe )
2 +
curve shifts to the left (i.e. the P 50 falls) while with instead of the usual Fe state. It may arise because
decreased affi nity for O 2 , the curve shifts to the of a hereditary defi ciency of methaemoglobin
right (i.e. the P 50 rises). reductase deficiency or inheritance of a structurally
Normally, in vivo , O 2 exchange operates between abnormal haemoglobin (Hb M). Hb Ms contain an
95% saturation (arterial blood) with a mean arterial amino acid substitution aff ecting the haem pocket
O 2 tension of 95 mmHg and 70% saturation of the globin chain. Toxic methaemoglobinaemia
(venous blood) with a mean venous O 2 tension of (and/or sulphaemoglobinaemia) occurs when a
40 mmHg (Fig. 2.9 ). drug or other toxic substance oxidizes haemoglobin.
The normal position of the curve depends on In all these states, the patient is likely to show
+
the concentration of 2,3 - DPG, H ions and CO 2 cyanosis.