
Page 341 - Maxwell House
P. 341
FEED LINE BASICS 321
and note that the surface current of TE01-mode field is deprived of the longitudinal component.
Therefore, the oversized and overmoded WC can be cut like a sausage into slices as shown in
Figure 6.6.12a without any real damage for TE01-mode. Meanwhile, all modes with the current
longitudinal component stop propagating. The gap between slices must be much less than the
wavelength to avoid detectable EM radiation from the WC. To keep such waveguide solid we
can put the thin dielectric rings between the slices and intrude everything into supporting plastic
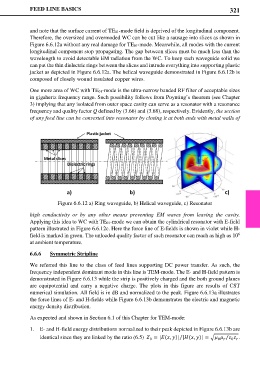
jacket as depicted in Figure 6.6.12a. The helical waveguide demonstrated in Figure 6.6.12b is
composed of closely wound insulated copper wires.
One more area of WC with TE01-mode is the ultra-narrow banded RF filter of acceptable sizes
in gigahertz frequency range. Such possibility follows from Poynting’s theorem (see Chapter
3) implying that any isolated from outer space cavity can serve as a resonator with a resonance
frequency and quality factor Q defined by (3.66) and (3.68), respectively. Evidently, the section
of any feed line can be converted into resonator by closing it at both ends with metal walls of
c)
Figure 6.6.12 a) Ring waveguide, b) Helical waveguide, c) Resonator
high conductivity or by any other means preventing EM waves from leaving the cavity.
Applying this idea to WC with TE01-mode we can obtain the cylindrical resonator with E-field
pattern illustrated in Figure 6.6.12c. Here the force line of E-fields is shown in violet while H-
field is marked in green. The unloaded quality factor of such resonator can reach as high as 10 6
at ambient temperature.
6.6.6 Symmetric Stripline
We referred this line to the class of feed lines supporting DC power transfer. As such, the
frequency independent dominant mode in this line is TEM-mode. The E- and H-field pattern is
demonstrated in Figure 6.6.13 while the strip is positively charged and the both ground planes
are equipotential and carry a negative charge. The plots in this figure are results of CST
numerical simulation. All field is in dB and normalized to the peak. Figure 6.6.13a illustrates
the force lines of E- and H-fields while Figure 6.6.13b demonstrates the electric and magnetic
energy density distribution.
As expected and shown in Section 6.1 of this Chapter for TEM-mode:
1. E- and H-field energy distributions normalized to their peak depicted in Figure 6.6.13b are
identical since they are linked by the ratio (6.5) = |(, )| |(, )| = � .
⁄
⁄
0
0
0 