
Page 343 - Maxwell House
P. 343
FEED LINE BASICS 323
w is too broad with respect to wavelength. The field pattern of one of such common TE-mode
is demonstrated in Figure 6.6.14.
One of the basic parameters of a stripline is its characteristic impedance defined by (6.8). We
know that all the impedance expressions in (6.8) for TEM-mode lead to the same results. The
standard practice is to use the expression = ⁄ and calculate the voltage and current from
(6.9) solving the integrals along one of the equipotential line. It sounds simple but in reality can
be implemented only numerically via the set of quite cumbersome expressions (see [2]) or
through the numerical solution of Maxwell equations. Note that the latter approach is more
flexible and less restrictive in the selection of stripline parameter. Anyway, our task is to
recognize the results we expect from computer simulations keeping in mind the simple but close
to reality EM field model. To do so, assume that in (6.9) = ∫ ∘ = ℎ and =
∮ ∘ = 2( + ) where and is the average intensity of E- and H-field,
respectively, over the integration path. In case of voltage, we choose the path as the straight line
connecting the strip center with ground plane. Looking back at the E-field pattern in Figure
6.6.14 we see that the E-field has almost uniform distribution over this path while is very
close to the peak of E-field in line. The value of is more difficult to interpret but the closed
integration path must go around the strip in any case and thus depends on strip perimeter.
Therefore,
ℎ 1
= ⁄ ~ = (6.42)
⁄
⁄
2(+) 2( ℎ+ ℎ)
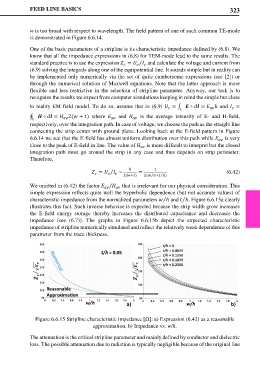
We omitted in (6.42) the factor / that is irrelevant for our physical consideration. This
simple expression reflects quite well the hyperbolic dependence (but not accurate values) of
characteristic impedance from the normalized parameters ℎ and ℎ. Figure 6.6.15a clearly
⁄
⁄
illustrates this fact. Such inverse behavior is expected because the strip width grow increases
the E-field energy storage thereby increases the distributed capacitance and decreases the
impedance (see (6.7)). The graphs in Figure 6.6.15b depict the expected characteristic
impedance of stripline numerically simulated and reflect the relatively weak dependence of this
parameter from the trace thickness.
Figure 6.6.15 Stripline characteristic impedance [Ω]: a) Expression (6.42) as a reasonable
approximation, b) Impedance vs. w/h.
The attenuation is the critical stripline parameter and mainly defined by conductor and dielectric
loss. The possible attenuation due to radiation is typically negligible because of the original line