
Page 67 - Carbon Frauds and Corruption
P. 67
Corruption of Bribery
Chapter 6 : Corruption in the “Carbon World”
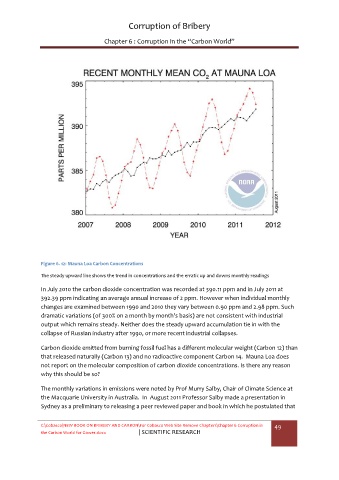
Figure 6. 12: Mauna Loa Carbon Concentrations
The steady upward line shows the trend in concentrations and the erratic up and downs monthly readings
In July 2010 the carbon dioxide concentration was recorded at 390.11 ppm and in July 2011 at
392.39 ppm indicating an average annual increase of 2 ppm. However when individual monthly
changes are examined between 1990 and 2010 they vary between 0.90 ppm and 2.98 ppm. Such
dramatic variations (of 300% on a month by month’s basis) are not consistent with industrial
output which remains steady. Neither does the steady upward accumulation tie in with the
collapse of Russian industry after 1990, or more recent industrial collapses.
Carbon dioxide emitted from burning fossil fuel has a different molecular weight (Carbon 12) than
that released naturally (Carbon 13) and no radioactive component Carbon 14. Mauna Loa does
not report on the molecular composition of carbon dioxide concentrations. Is there any reason
why this should be so?
The monthly variations in emissions were noted by Prof Murry Salby, Chair of Climate Science at
the Macquarie University in Australia. In August 2011 Professor Salby made a presentation in
Sydney as a preliminary to releasing a peer reviewed paper and book in which he postulated that
C:\Cobasco\NEW BOOK ON BRIBERY AND CARBON\For Cobasco Web Site Remove Chapters\Chapter 6 Corruption in 49
the Carbon World for Gower.docx | SCIENTIFIC RESEARCH