


Page 27 - Handout of Rreport Writting
P. 27
Faculty of Engineering


                   •  Encouraging discussion


                   •  Responding to audience feedback


                   •  Using real-life examples


               Engaging the audience helps maintain their attention and makes the presentation more dynamic

               and effective.


                                                        )
               2.4 Using Graphs in Presentations       ةيميدقتلا ضورعلا ف ةينايبلا تا   مو   سرلا مادختسا(


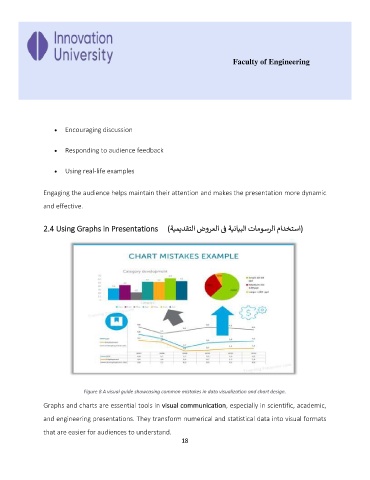
                             Figure 8 A visual guide showcasing common mistakes in data visualization and chart design.

               Graphs and charts are essential tools in visual communication, especially in scientific, academic,

               and engineering presentations. They transform numerical and statistical data into visual formats
               that are easier for audiences to understand.
                                                             18

