


Page 31 - Handout of Rreport Writting
P. 31
Faculty of Engineering


               2.4.1.3 Pie Chart ( ىرئاد ططخم)


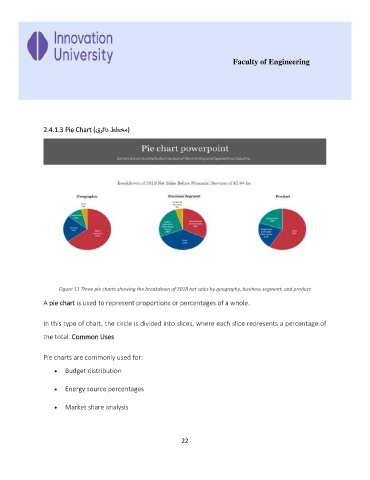
                     Figure 11 Three pie charts showing the breakdown of 2018 net sales by geography, business segment, and product

               A pie chart is used to represent proportions or percentages of a whole.


               In this type of chart, the circle is divided into slices, where each slice represents a percentage of


               the total. Common Uses

               Pie charts are commonly used for:

                   •  Budget distribution


                   •  Energy source percentages

                   •  Market share analysis


                                                             22

