


Page 30 - Handout of Rreport Writting
P. 30
Faculty of Engineering


                   •  Showing differences between groups


               2.4.1.2 Line Graph  )ظخلا ئايبلا مسرلا(


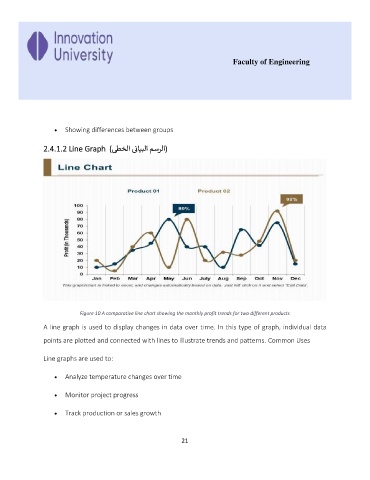
                           Figure 10 A comparative line chart showing the monthly profit trends for two different products

               A line graph is used to display changes in data over time. In this type of graph, individual data

               points are plotted and connected with lines to illustrate trends and patterns. Common Uses

               Line graphs are used to:


                   •  Analyze temperature changes over time


                   •  Monitor project progress

                   •  Track production or sales growth


                                                             21

