
Page 10 - Poster presentation KVAC 22
P. 10
Cell Count in Canine and Feline Peritoneal and
Pleural Fluids: A Comparison of Automated Hematology
Analyzers and Manual Microscopy Method
Pattara-anong Buppata, Jeerasak Khlongkhlaeo, Manassanan Borisutpeth, Pithai Kanbutra*
Faculty of Veterinary Medicine, Khon Kaen University, Thailand; *Corresponding Author
Serous (serum-like, high protein content) body fluid consists of pleural, peritoneal and pericardial fluids. Total nucleated
cell count (TNCC) and red blood cell count (RBCC) are parts of serous body fluid analysis and provide important
laboratory findings for diagnosis in veterinary practices [1, 2]. Although TNCC and RBCC can be determined by manual
or automated methods, a manual hemocytometry counting is still the standard procedure in most clinical diagnostic
laboratory due to the Clinical and Laboratory Standards Institute (CLSI) recommendation [3]. The manual counting has
been considered as an accurate and reliable method, however it is time-consuming and labor-intensive. Moreover, it
would be imprecise by dilution and calculation faults [2]. The automated hematology analyzer has become an attractive
alternative because it is easy to operate and expeditious. This study was aimed to evaluate and compare TNCC and
RBCC in dog and cat serous body fluids by two affordable automated hematology analyzers and the manual method.
1. Serous fluid samples and laboratory analysis:
The TNCC and RBCC in 19 serous body fluids (peritoneal=13 and pleural=6) collected from 13 dogs and 6 cats submitted
at the Veterinary Clinical Diagnostic Laboratory, Veterinary Teaching Hospital, Faculty of Veterinary Medicine, Khon
Kaen University were determined using ABX Micros ESV60 (Horiba Medical, France), Mindray BC-5000Vet (Mindray Bio-
Medical Electronics, China), and the manual microscopic enumeration using hemocytometer.
2. Data analysis:
The results were compared using Pearson product moment correlation, Nonlinear (polynomial, linear) regression, and
Bland–Altman difference plot.
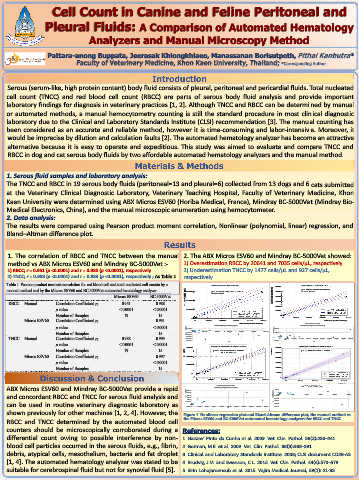
1. The correlation of RBCC and TNCC between the manual 2. The ABX Micros ESV60 and Mindray BC-5000Vet showed:
method vs ABX Micros ESV60 and Mindray BC-5000Vet :- 1) Overestimation RBCC by 20641 and 7035 cells/µL, respectively
1) RBCC; r = 0.951 (p <0.0001) and r = 0.988 (p <0.0001), respectively 2) Underestimation TNCC by 1477 cells/µL and 927 cells/µL,
2) TNCC; r = 0.988 (p <0.0001) and r = 0.933 (p <0.0001), respectively ; As Table 1 respectively
Table 1. Pearson product moment correlation for red blood cell and total nucleated cell counts by a Red Blood Cell Count 600000 Red Blood Cell Count
manual method and by the Micros ESV60 and BC-5000Vet automated hematology analyzer. 600000 y = 20640.6872+1.1351X 500000 y = 7034.8034+0.8925X
R = 0.9882
Micros ESV60 BC-5000Vet Micros ESV60 (cells/microL) R=0.9514 BC-5000Vet (cells/microL) 400000
RBCC Manual Correlation Coefficient (r) 0.951 0.988 400000 300000
p-value < 0.0001 < 0.0001 200000 200000 x column vs y column
x column vs y column 100000 manual vs BC-5000Vet
95% Confidence Band
manual vs Micros ESV60
Number of Samples 19 15 95% Confidence Band 0 95% Prediction Band
95% Prediction Band
Micros ESV60 Correlation Coefficient (r) 0.931 0 0 100000 200000 300000 400000 500000 0 100000 200000 300000 400000 500000
manual (cells/microL)
Red Blood Cells Count manual (cells/microL) Red Blood Cell Count
p-value < 0.0001 50,000 Difference plot (Bland-Altman plot) 100000 Difference plot (Bland-Altman plot)
0
Number of Samples 15 Manual-Micros ESV60 -100,000 100,000 200,000 300,000 400,000 500,000 600,000 Manual-BC-5000Vet 50000
-50,000 0
TNCC Manual Correlation Coefficient (r) 0.988 0.993 -150,000 0 0 50,000 100,000 150,000 200,000 250,000 300,000 350,000 400,000 450,000 500,000
-200,000
-250,000 mean -50000 mean
p-value < 0.0001 < 0.0001 Total Nucleated Cells Count
300000 300000 Total Nucleated Cells Count
Number of Samples 19 15 y = 0.8230X-1476.6206 BC-5000Vet 250000 y = 1.1093X - 927.7575
R = 0.9876
Micros ESV60 Correlation Coefficient (r) 0.997 Micros ESV60 200000 200000
p-value < 0.0001 150000
100000
Number of Samples 15 100000
0 manual vs Micros ESV60 50000 manual vs BC-5000Vet
95% Confidence Band
95% Confidence Band
95% Prediction Band
0 95% Prediction Band
0 50000 100000 150000 200000 250000 0 50000 100000 150000 200000
Manual Manual
ABX Micros ESV60 and Mindray BC-5000Vet provide a rapid 60000 Difference plot (Bland-Altman plot) 10000 Difference plot (Bland-Altman plot)
Total Nucleated Cells Count
Total Nucleated Cells Count
and concordant RBCC and TNCC for serous fluid analysis and Manual-Micros ESV60 50000 Manual-BC-5000Vet -10000 45000 95000 145000 195000 245000
0
-5000
40000
30000
-20000
can be used in routine veterinary diagnostic laboratory as 20000 -30000
10000
-40000
0
40000
60000
0
20000
80000
100000
-10000
mean 120000 140000 160000 180000 200000 -50000 mean
shown previously for other machines [1, 2, 4]. However, the Figure 1. Nonlinear regression plot and Bland-Altman difference plot, the manual method vs
RBCC and TNCC determined by the automated blood cell the Micros ESV60 and BC-5000Vet automated hematology analyzers for RBCC and TNCC.
counters should be microscopically corroborated during a References:
differential count owing to possible interference by non- 1. Nazare´ Pinto da Cunha et al. 2009. Vet. Clin. Pathol. 38(2):230–241.
blood cell particles occurred in the serous fluids, e.g., fibrin, 2. Gorman, M.E. et al. 2009. Vet. Clin. Pathol. 38(3):388–391.
debris, atypical cells, mesothelium, bacteria and fat droplet 3. Clinical and Laboratory Standards Institute. 2008; CLSI document CD28-A3.
[1, 4]. The automated hematology analyzer was stated to be 4. Brudvig, J.M. and Swenson, C.L. 2015. Vet. Clin. Pathol. 44(4):570–579.
suitable for cerebrospinal fluid but not for synovial fluid [5]. 5. Sirin Lohajaroensub et al. 2015. Vajira Medical Journal, 59(1): 21-33.