
Page 76 - Towards A Sustainable Future 2024
P. 76
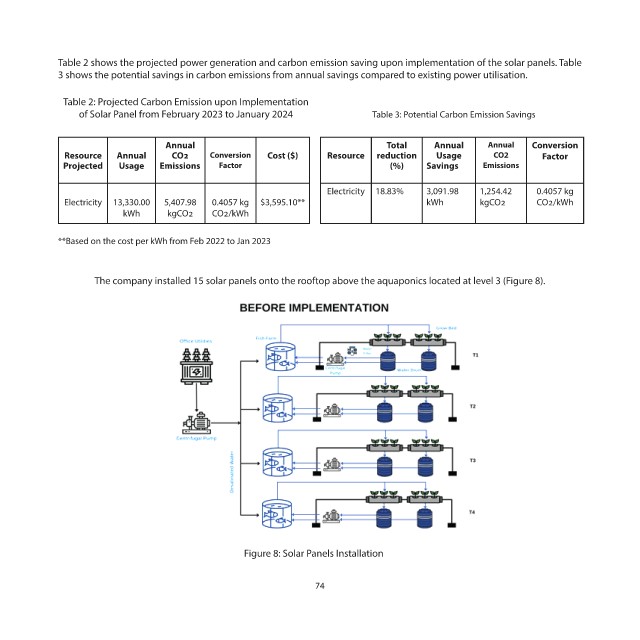
Table 2 shows the projected power generation and carbon emission saving upon implementation of the solar panels. Table
            3 shows the potential savings in carbon emissions from annual savings compared to existing power utilisation.


             Table 2: Projected Carbon Emission upon Implementation
                of Solar Panel from February 2023 to January 2024         Table 3: Potential Carbon Emission Savings


                                 Annual                                     Total     Annual    Annual   Conversion
              Resource  Annual    CO2     Conversion   Cost ($)  Resource  reduction   Usage     CO2       Factor
             Projected  Usage   Emissions   Factor                           (%)    Savings    Emissions

                                                                 Electricity  18.83%  3,091.98   1,254.42   0.4057 kg
              Electricity  13,330.00   5,407.98   0.4057 kg   $3,595.10**           kWh       kgCO2       CO2/kWh
                         kWh      kgCO2   CO2/kWh


            **Based on the cost per kWh from Feb 2022 to Jan 2023


                   The company installed 15 solar panels onto the rooftop above the aquaponics located at level 3 (Figure 8).


                                                 Figure 8: Solar Panels Installation


                                                              74