
Page 166 - BUKU SYNOPSIS
P. 166
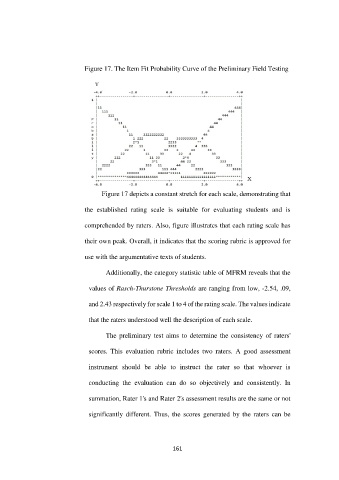
Figure 17. The Item Fit Probability Curve of the Preliminary Field Testing


                                         Figure 17 depicts a constant stretch for each scale, demonstrating that

                               the  established  rating  scale  is  suitable  for  evaluating  students  and  is

                               comprehended by raters. Also, figure illustrates that each rating scale has


                               their own peak. Overall, it indicates that the scoring rubric is approved for


                               use with the argumentative texts of students.

                                          Additionally, the category statistic table of MFRM reveals that the

                                values of Rasch-Thurstone Thresholds are ranging from low, -2.54, .09,


                                and 2.43 respectively for scale 1 to 4 of the rating scale. The values indicate

                                that the raters understood well the description of each scale.


                                          The preliminary  test  aims  to  determine the consistency  of  raters'

                                scores.  This  evaluation  rubric  includes  two  raters.  A  good  assessment


                                instrument  should  be  able  to  instruct  the  rater  so  that  whoever  is

                                conducting  the  evaluation  can  do  so  objectively  and  consistently.  In

                                summation, Rater 1's and Rater 2's assessment results are the same or not


                                significantly  different.  Thus,  the  scores  generated  by  the  raters  can  be


                                                              161