
Page 30 - Rapid Review of ECG Interpretation in Small Animal Practice, 2nd Edition
P. 30
Evaluation of the Electrocardiogram
The QRS complex ventricle, and the potential presence of ventricular
The QRS complex represents ventricular depolar-
VetBooks.ir ization. Standard nomenclature describes the first hypertrophy. QRS complexes generated by a beat of
supraventricular origin (sinus node or supraventricu-
negative deflection as the Q wave, the first positive
deflection as the R wave, and the first negative de- lar foci such as the atria or AV nodal junction) are
flection following the first positive deflection as the typically narrow and positive in lead II, while those
S wave. Note that normal QRS complexes do not that originate from ventricular foci are wider in dura-
necessarily contain all three waveforms, and in dogs, tion and “bizarre” in their appearance as compared
a high degree of individual variability is seen. The to normal sinus beats.
normal sequence of ventricular depolarization re- Conduction disturbances within the ventricles can
sults in a QRS complex of relatively short duration also alter the morphology of the QRS complexes.
and with a net positive polarity in leads II, III, and Finally, ventricular hypertrophy can increase the
aVF. The normal duration and amplitude of the QRS amplitude of the QRS complex and the duration
complex in the dog and cat is shown in Table 2.1. A (albeit to a lesser degree than a bundle branch block)
key component of ECG analysis is inspection of the or change the MEA (as in the case of right heart
QRS morphology in lead II, which can provide clues enlargement, Fig. 2.6, p. 15).
to the complex’s origin, its conduction through the
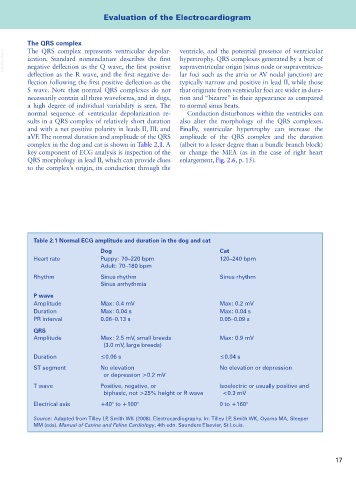
Table 2.1 Normal ECG amplitude and duration in the dog and cat
Dog Cat
Heart rate Puppy: 70–220 bpm 120–240 bpm
Adult: 70–180 bpm
Rhythm Sinus rhythm Sinus rhythm
Sinus arrhythmia
P wave
Amplitude Max: 0.4 mV Max: 0.2 mV
Duration Max: 0.04 s Max: 0.04 s
PR interval 0.06–0.13 s 0.05–0.09 s
QRS
Amplitude Max: 2.5 mV, small breeds Max: 0.9 mV
(3.0 mV, large breeds)
Duration ≤0.06 s ≤0.04 s
ST segment No elevation No elevation or depression
or depression >0.2 mV
T wave Positive, negative, or Isoelectric or usually positive and
biphasic, not >25% height or R wave <0.3 mV
Electrical axis +40° to +100° 0 to +160°
Source: Adapted from Tilley LP, Smith WK (2008). Electrocardiography. In: Tilley LP, Smith WK, Oyama MA, Sleeper
MM (eds). Manual of Canine and Feline Cardiology, 4th edn. Saunders Elsevier, St Louis.
17