
Page 31 - Rapid Review of ECG Interpretation in Small Animal Practice, 2nd Edition
P. 31
Evaluation of the Electrocardiogram
The ST segment stenosis), electrolyte imbalances, acute hypoxia
(anesthesia), or suspected myocardial infarction (rare).
The ST segment (or interval) represents the time
VetBooks.ir between the end of ventricular depolarization and the The T wave
beginning of ventricular repolarization. In general,
the ST segment should not be either elevated or The T wave represents ventricular repolarization.
depressed as compared to baseline by more than 0.2 The normal T wave in both dogs and cats demon-
mV. In human patients, ST segment abnormalities strates a high degree of variability and can be posi-
occur in instances of myocardial ischemia/infarction, tive, negative, biphasic, or of very low amplitude;
pericardial disease, or electrolyte imbalances. In dogs however, the T wave should be consistent from
and cats, ST segment abnormalities are occasionally beat to beat during a normal rhythm. The normal
detected in cases of myocardial disease (dilated characteristics of the T wave in dogs and cats are
cardiomyopathy), congenital heart disease (subaortic shown in Table 2.1. As compared to human pa-
tients, T wave changes in the dog and cat are rela-
tively nonspecific and poorly characterized. T wave
abnormalities can be seen in instances of electrolyte
abnormalities, hypoxia, conduction abnormalities,
or drug toxicity (i.e., digoxin). The duration of time
from the start of the QRS complex to the end of the
50 mm/s
I 10 mm/mV T wave is called the QT interval.
CRITERIA FOR HEART ENLARGEMENT
The criteria for heart enlargement in the dog and
cat are shown in Table 2.2. In brief, left atrial
enlargement is manifest as P wave of increased
II duration (P mitrale) or increased amplitude, and left
ventricular enlargement as QRS waveforms with
increased R wave amplitude and QRS duration.
Right atrial enlargement is manifest as P waves of
increased amplitude (P pulmonale) or increased
III duration, and right ventricular enlargement as a
right MEA shift and prominent S waves. Examples
of left and right heart enlargement patterns are
shown in Figures 2.8 and 2.9.
aVR
aVL
aVF
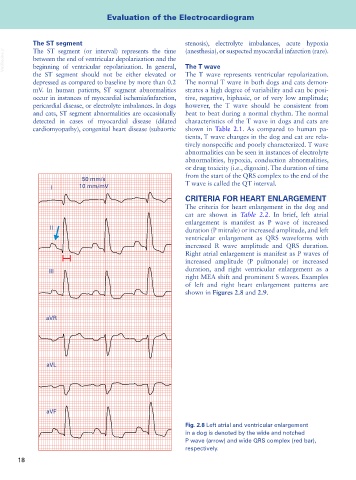
Fig. 2.8 Left atrial and ventricular enlargement
in a dog is denoted by the wide and notched
P wave (arrow) and wide QRS complex (red bar),
respectively.
18