
Page 609 - Introduction to Business
P. 609
CHAPTER 16 Managing Business Operations 583
time, products that exhibit abnormal variations would not conform to specifica-
tions. When the production system is producing products with normal variations,
we say it is an in-control production system; when the production system is in-control production system The
producing products with abnormal variations, we say it is an out-of-control production system where products
produced exhibit normal variations
production system and we should perform any necessary adjustments to bring it
out-of-control production system The
in control.
production system where products
By means of the control chart, the operations manager can help the production produced exhibit abnormal variations
system operators to detect when product variations are normal and when they are control chart A chart used to detect if
abnormal. For example, one of the design specifications for a box of detergent is the production system is in control or
that it must contain 48 ounces. Using historical data and statistical analysis, the out of control
operations manager has determined that when the production system is in control
and a random sample of ten boxes is taken, the average number of ounces per box
is 48 (although individual boxes may contain more or fewer ounces per box). How-
ever, due to normal variations in the filling process, some samples could have an
average as high as 48.3 ounces, called the upper control limit, or as
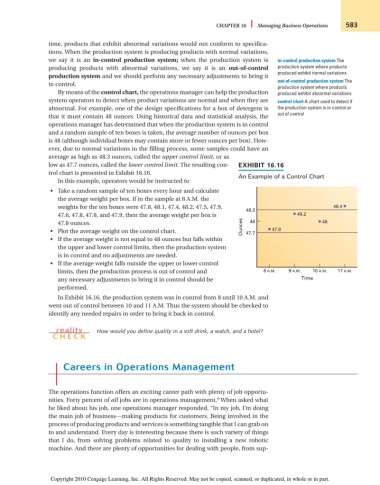
low as 47.7 ounces, called the lower control limit. The resulting con- EXHIBIT 16.16
trol chart is presented in Exhibit 16.16.
An Example of a Control Chart
In this example, operators would be instructed to
• Take a random sample of ten boxes every hour and calculate
the average weight per box. If in the sample at 8 A.M. the
weights for the ten boxes were 47.8, 48.1, 47.4, 48.2, 47.5, 47.9, 48.4
48.3
47.6, 47.8, 47.8, and 47.9, then the average weight per box is 48.2
47.8 ounces. Ounces 48 48
• Plot the average weight on the control chart. 47.7 47.8
• If the average weight is not equal to 48 ounces but falls within
the upper and lower control limits, then the production system
is in control and no adjustments are needed.
• If the average weight falls outside the upper or lower control
limits, then the production process is out of control and 8 A.M. 9 A.M. 10 A.M. 11 A.M.
any necessary adjustments to bring it in control should be Time
performed.
In Exhibit 16.16, the production system was in control from 8 until 10 A.M. and
went out of control between 10 and 11 A.M. Thus the system should be checked to
identify any needed repairs in order to bring it back in control.
reality How would you define quality in a soft drink, a watch, and a hotel?
CH ECK
Careers in Operations Management
The operations function offers an exciting career path with plenty of job opportu-
9
nities. Forty percent of all jobs are in operations management. When asked what
he liked about his job, one operations manager responded, “In my job, I’m doing
the main job of business—making products for customers. Being involved in the
process of producing products and services is something tangible that I can grab on
to and understand. Every day is interesting because there is such variety of things
that I do, from solving problems related to quality to installing a new robotic
machine. And there are plenty of opportunities for dealing with people, from sup-
Copyright 2010 Cengage Learning, Inc. All Rights Reserved. May not be copied, scanned, or duplicated, in whole or in part.