
Page 442 - Adams and Stashak's Lameness in Horses, 7th Edition
P. 442
408 Chapter 3
VetBooks.ir
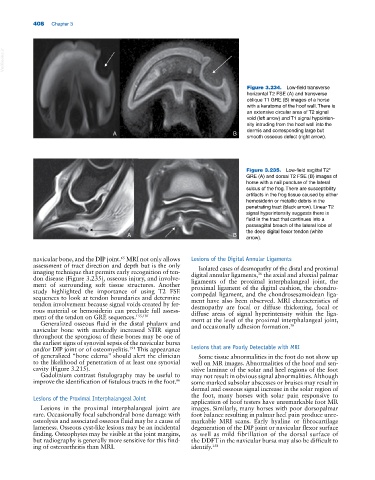
Figure 3.234. Low‐field transverse
horizontal T2 FSE (A) and transverse
oblique T1 GRE (B) images of a horse
with a keratoma of the hoof wall. There is
an extensive circular area of T2 signal
void (left arrow) and T1 signal hypointen
sity intruding from the hoof wall into the
dermis and corresponding large but
A B
smooth osseous defect (right arrow).
Figure 3.235. Low‐field sagittal T2*
GRE (A) and dorsal T2 FSE (B) images of
horse with a nail puncture of the lateral
sulcus of the frog. There are susceptibility
artifacts in the frog tissue caused by either
hemosiderin or metallic debris in the
penetrating tract (black arrow). Linear T2
signal hyperintensity suggests there is
fluid in the tract that continues into a
parasagittal breach of the lateral lobe of
the deep digital flexor tendon (white
A B arrow).
navicular bone, and the DIP joint. MRI not only allows Lesions of the Digital Annular Ligaments
65
assessment of tract direction and depth but is the only Isolated cases of desmopathy of the distal and proximal
imaging technique that permits early recognition of ten digital annular ligaments, the axial and abaxial palmar
36
don disease (Figure 3.235), osseous injury, and involve ligaments of the proximal interphalangeal joint, the
ment of surrounding soft tissue structures. Another proximal ligament of the digital cushion, the chondro
study highlighted the importance of using T2 FSE compedal ligament, and the chondrosesamoidean liga
sequences to look at tendon boundaries and determine ment have also been observed. MRI characteristics of
tendon involvement because signal voids created by fer desmopathy are focal or diffuse thickening, focal or
rous material or hemosiderin can preclude full assess diffuse areas of signal hyperintensity within the liga
ment of the tendon on GRE sequences. 155,181 ment at the level of the proximal interphalangeal joint,
Generalized osseous fluid in the distal phalanx and and occasionally adhesion formation. 36
navicular bone with markedly increased STIR signal
throughout the spongiosa of these bones may be one of
the earliest signs of synovial sepsis of the navicular bursa
and/or DIP joint or of osteomyelitis. This appearance Lesions that are Poorly Detectable with MRI
191
of generalized “bone edema” should alert the clinician Some tissue abnormalities in the foot do not show up
to the likelihood of penetration of at least one synovial well on MR images. Abnormalities of the hoof and sen
cavity (Figure 3.215). sitive laminae of the solar and heel regions of the foot
Gadolinium contrast fistulography may be useful to may not result in obvious signal abnormalities. Although
improve the identification of fistulous tracts in the foot. 66 some marked subsolar abscesses or bruises may result in
dermal and osseous signal increase in the solar region of
Lesions of the Proximal Interphalangeal Joint the foot, many horses with solar pain responsive to
application of hoof testers have unremarkable foot MR
Lesions in the proximal interphalangeal joint are images. Similarly, many horses with poor dorsopalmar
rare. Occasionally focal subchondral bone damage with foot balance resulting in palmar heel pain produce unre
osteolysis and associated osseous fluid may be a cause of markable MRI scans. Early hyaline or fibrocartilage
lameness. Osseous cyst‐like lesions may be an incidental degeneration of the DIP joint or navicular flexor surface
finding. Osteophytes may be visible at the joint margins, as well as mild fibrillation of the dorsal surface of
but radiography is generally more sensitive for this find the DDFT in the navicular bursa may also be difficult to
ing of osteoarthritis than MRI. identify. 158