
Page 171 - Clinical Small Animal Internal Medicine
P. 171
16 Imaging in Cardiovascular Disease 139
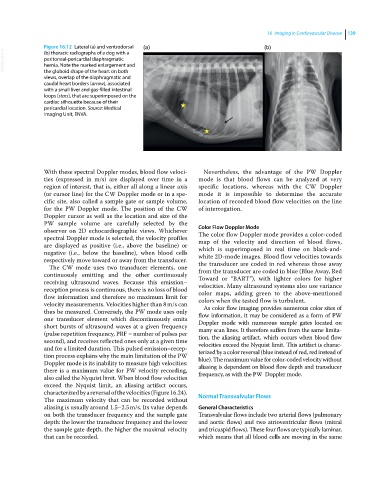
Figure 16.12 Lateral (a) and ventrodorsal (a) (b)
VetBooks.ir peritoneal‐pericardial diaphragmatic
(b) thoracic radiographs of a dog with a
hernia. Note the marked enlargement and
the globoid shape of the heart on both
views, overlap of the diaphragmatic and
caudal heart borders (arrow), associated
with a small liver and gas‐filled intestinal
loops (stars), that are superimposed on the
cardiac silhouette because of their
pericardial location. Source: Medical
Imaging Unit, ENVA.
With these spectral Doppler modes, blood flow veloci- Nevertheless, the advantage of the PW Doppler
ties (expressed in m/s) are displayed over time in a mode is that blood flows can be analyzed at very
region of interest, that is, either all along a linear axis specific locations, whereas with the CW Doppler
(or cursor line) for the CW Doppler mode or in a spe- mode it is impossible to determine the accurate
cific site, also called a sample gate or sample volume, location of recorded blood flow velocities on the line
for the PW Doppler mode. The position of the CW of interrogation.
Doppler cursor as well as the location and size of the
PW sample volume are carefully selected by the Color Flow Doppler Mode
observer on 2D echocardiographic views. Whichever The color flow Doppler mode provides a color‐coded
spectral Doppler mode is selected, the velocity profiles map of the velocity and direction of blood flows,
are displayed as positive (i.e., above the baseline) or which is superimposed in real time on black‐and‐
negative (i.e., below the baseline), when blood cells white 2D‐mode images. Blood flow velocities towards
respectively move toward or away from the transducer. the transducer are coded in red whereas those away
The CW mode uses two transducer elements, one
continuously emitting and the other continuously from the transducer are coded in blue (Blue Away, Red
Toward or “BART”), with lighter colors for higher
receiving ultrasound waves. Because this emission– velocities. Many ultrasound systems also use variance
reception process is continuous, there is no loss of blood color maps, adding green to the above‐mentioned
flow information and therefore no maximum limit for colors when the tested flow is turbulent.
velocity measurements. Velocities higher than 8 m/s can As color flow imaging provides numerous color sites of
thus be measured. Conversely, the PW mode uses only flow information, it may be considered as a form of PW
one transducer element which discontinuously emits Doppler mode with numerous sample gates located on
short bursts of ultrasound waves at a given frequency many scan lines. It therefore suffers from the same limita-
(pulse repetition frequency, PRF = number of pulses per tion, the aliasing artifact, which occurs when blood flow
second), and receives reflected ones only at a given time velocities exceed the Nyquist limit. This artifact is charac-
and for a limited duration. This pulsed emission–recep- terized by a color reversal (blue instead of red, red instead of
tion process explains why the main limitation of the PW blue). The maximum value for color‐coded velocity without
Doppler mode is its inability to measure high velocities: aliasing is dependent on blood flow depth and transducer
there is a maximum value for PW velocity recording, frequency, as with the PW Doppler mode.
also called the Nyquist limit. When blood flow velocities
exceed the Nyquist limit, an aliasing artifact occurs,
characterized by a reversal of the velocities (Figure 16.24). Normal Transvalvular Flows
The maximum velocity that can be recorded without
aliasing is usually around 1.5–2.5 m/s. Its value depends General Characteristics
on both the transducer frequency and the sample gate Transvalvular flows include two arterial flows (pulmonary
depth: the lower the transducer frequency and the lower and aortic flows) and two atrioventricular flows (mitral
the sample gate depth, the higher the maximal velocity and tricuspid flows). These four flows are typically laminar,
that can be recorded. which means that all blood cells are moving in the same